Meet The Robos
By Mike Narouei, Content Producer at Boring Money
22 June, 2021
The Basics
Robo advisers & performance
Robo advisers are a relatively new way to invest for people who don’t give a hoot about the minutiae of stock markets, for people who want someone else to do it for them…or even the most seasoned old dog who knows that they can’t be bothered with the ongoing maintenance of a portfolio.
Robo advisers offer an all-in-one investment journey which does it all for you. You need to choose which robo adviser you like and then take the robo's short questionnaire to work out what your risk profile is. This helps them to work out how you feel about risk and to map an appropriate collection of investments to you.
Read on below to see how we analyse and compare the performance of nine leading robo advisers which together represent over 80% of UK robo adviser assets today. The tabs above will take you through three different risk profiles. Or collections of investments which range from the more sedate cash-like stuff to the more volatile shares.
You can use these pages to get a deeper understanding of robos and see how they have performed between 2018 and 2020
Who are the robo advisers?

What portfolios did we look at?
For each robo-adviser we looked at three different portfolios: a low-risk, medium-risk, and high-risk portfolio.
Low risk portfolios are like souped-up cash. Cash like, but with a few riskier assets in the mix, mainly bonds. Basically, the least risky option.
Medium risk portfolios are roughly half shares and half cash/bonds. Not the riskiest, but has a bit of a kick.
High risk portfolios are in around 100% shares. This is like investing in the top 100 UK shares.
The small print
We have tried to keep this guide to robo returns relatively simple. You tell us you want to know how much you could make. And how much you could lose. And who is any good.
Unfortunately, investments are a bit more complex than cash. So we’d just add four things to consider.
Cash is pretty easy to assess and compare. What’s the rate? Is it with a credible provider? Job done. Investments are a bit trickier. Simply picking the group with the highest returns takes no account of how they have achieved those returns. Let’s give a really extreme example. Say we set up a scheme and invested 100% in a new tech firm which made cloud stuff which no-one understood. And that stock doubled. If you bought on returns alone you would think we were very smart. If you looked at the stratospheric risk we had taken with your money – if that one firm had gone belly-up you’d have lost everything – you wouldn’t go near us. Investing is a game of balancing risk with returns.
So how to look at risk. Each of these groups takes on different levels of risk to get their returns. As most of these robo advisers are relatively new, we only have data for a couple of years for most. So it’s still a bit early to draw robust conclusions. We can tell you the most that you would have lost in any one year which we hope helps to quantify the risk involved. As track records increase we can get more specific.
When investment bods talk about risk, they’re not talking about the risk of losing it all. They are talking about the volatility of your investment. About how much the value jumps around and up and down. A risky asset, or a spicy portfolio, could jump from £100 to £70 to £120 over the course of a year (just as an example). So the risk is volatility, not the risk that you could lose it all. A massive benefit of robo advisers is that they spread your money around loads of different investments and regions so you’re putting your investment eggs in loads of different baskets. No-one can guarantee things won’t head south but the chances of losing it all are absolutely minute.
Costs. Unlike with most savings accounts, you do pay a fee for having your money invested. This is not often as simple to calculate as it should be. You will pay the robo adviser a fee for administration and their calculations/number-crunching. And you’ll also pay a fee for the investments they buy on your behalf. Around 1% a year is pretty decent value for a managed passive portfolio.
Robo-adviser Returns
Average returns
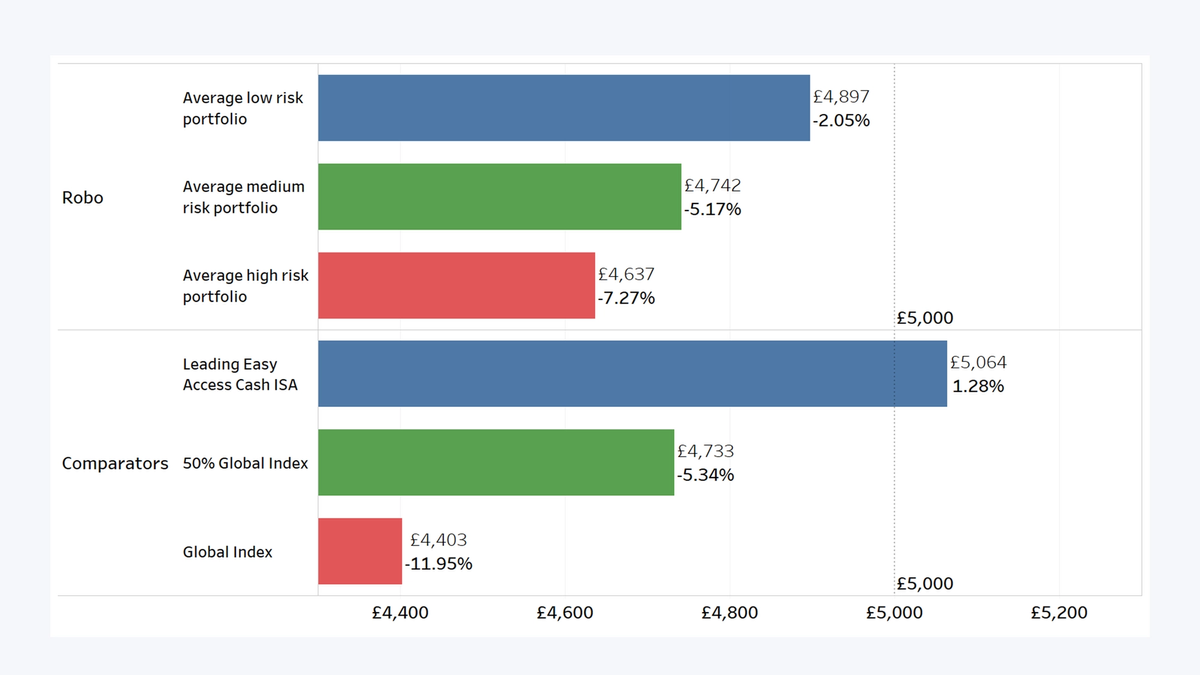
If we look at just 2018, most investors saws negative return, as stock markets tumbled over the last 3 months of 2018. For example the main UK market – the FTSE 100 – fell by nearly 10% over this period. However, investing is for the longer term and if we look over 2017 and 2018, the picture is slightly more positive.
You can see that the lowest risk robos didn’t do so well as cash. And that’s because the shares bit of the portfolios has had a wobble. This should not put off longer-term investors but reminds us of why this isn’t a short-term game. We know that snapshots in time can be misleading – since the end of 2018 the main UK market is up by about 8% for example so don’t be entirely put off by these charts which cover a fairly unpleasant three months in a spooked stock market.
We compare the medium risk portfolios to a 50% Global Index. This maps what what a basket half made up of the world’s biggest shares and half made up of cash would have done. The full Global Index is compared to the high risk portfolios and shows what a basket of the largest shares from across the world would have performed.
Returns on £5,000 invested from 1st January 2018 to 31st December 2018

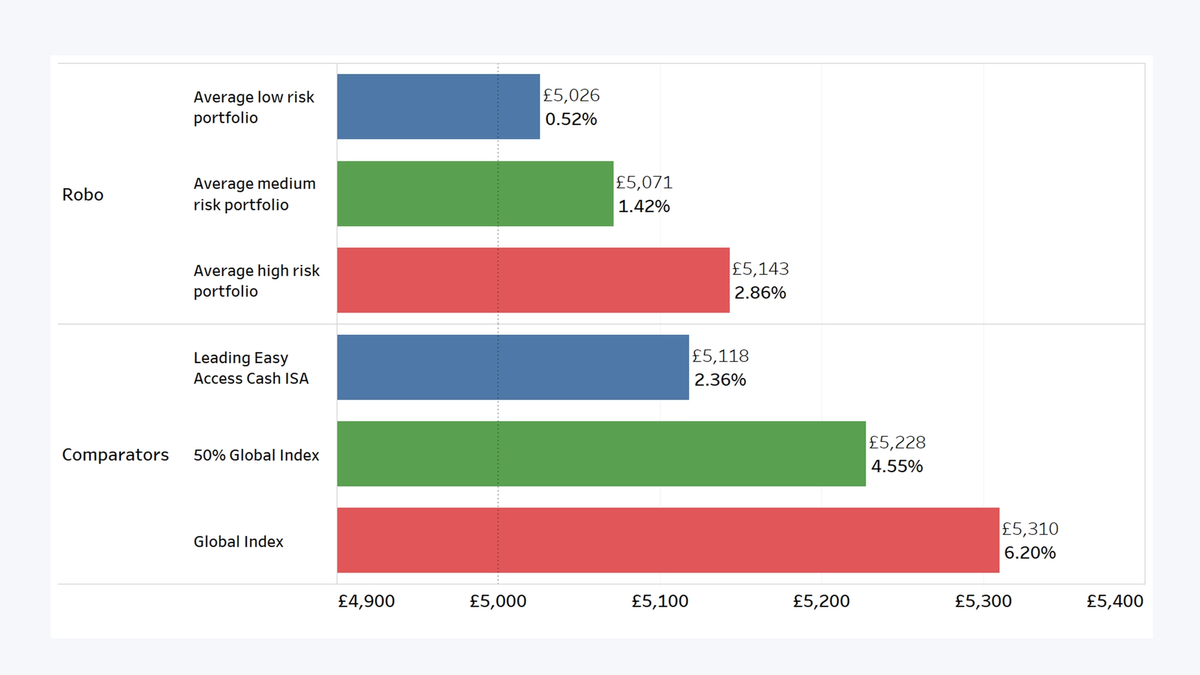
Returns on £5,000 invested from 1st January 2017 to 31st December 2018

Low risk portfolios
The charts below show what would have happened if you had invested £5,000 over 2017 and 2018.
All the nine robo-advisers have at least a 1-year track record, and seven have at least a 2-year track record.
The 1-year performance looks at what would have happened if you invested from 1st January 2018 to 31st December 2018. The 2-year performance looks at 1st January 2017 to 31st December 2018.
Low risk portfolio returns on £5,000 invested up to the 31st December 2018
What is in these portfolios
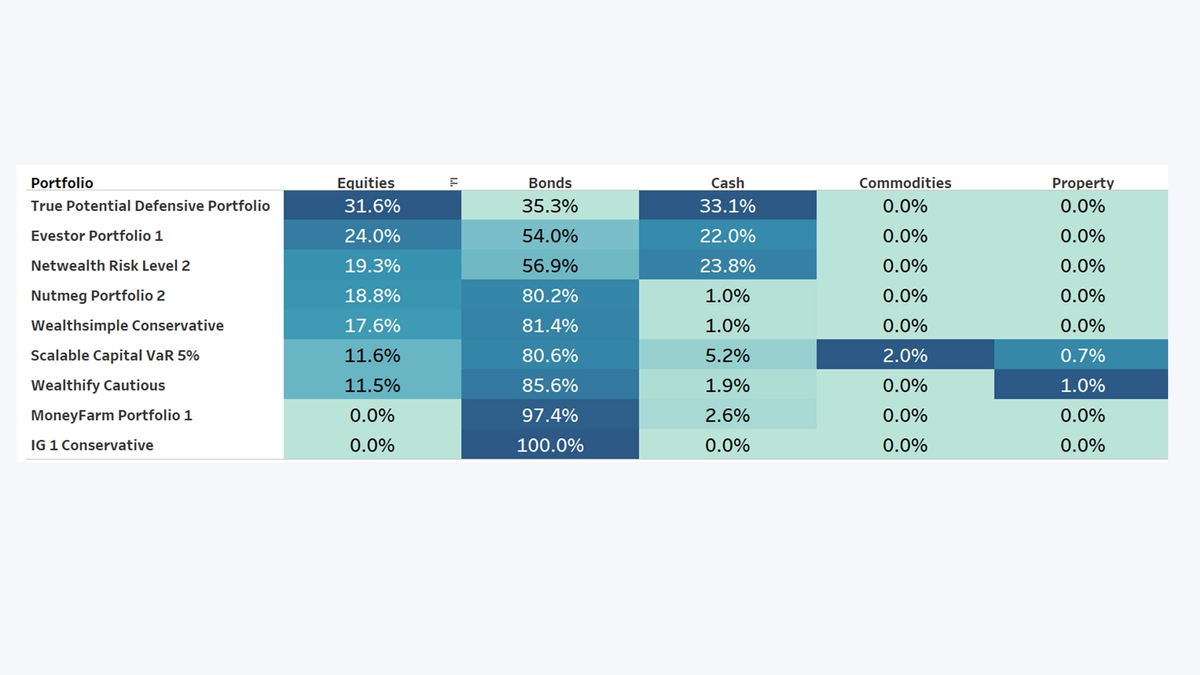
A nice thing about robo advisers is that they spread your money around. One single investment from you and your cash is spread into cash, shares, property and more - and across the globe too.
The lower risk portfolios will have more cash and bonds than shares - this means you will have a smoother ride but probably not make as much over the longer term.
As a general rule, you would expect equities (that's just another way of saying shares) to be riskier than bonds, which will also be riskier than cash. A riskier asset will typically perform better than a less risky asset over the long term.
A bumpy ride is the trade-off for potentially higher returns.
Robo-adviser “low risk” portfolio asset allocations over the 12 months to 31st December 2018Robo-adviser “low risk” portfolio asset allocations over the 12 months to 31st December 2018

How much risk did these portfolios take?
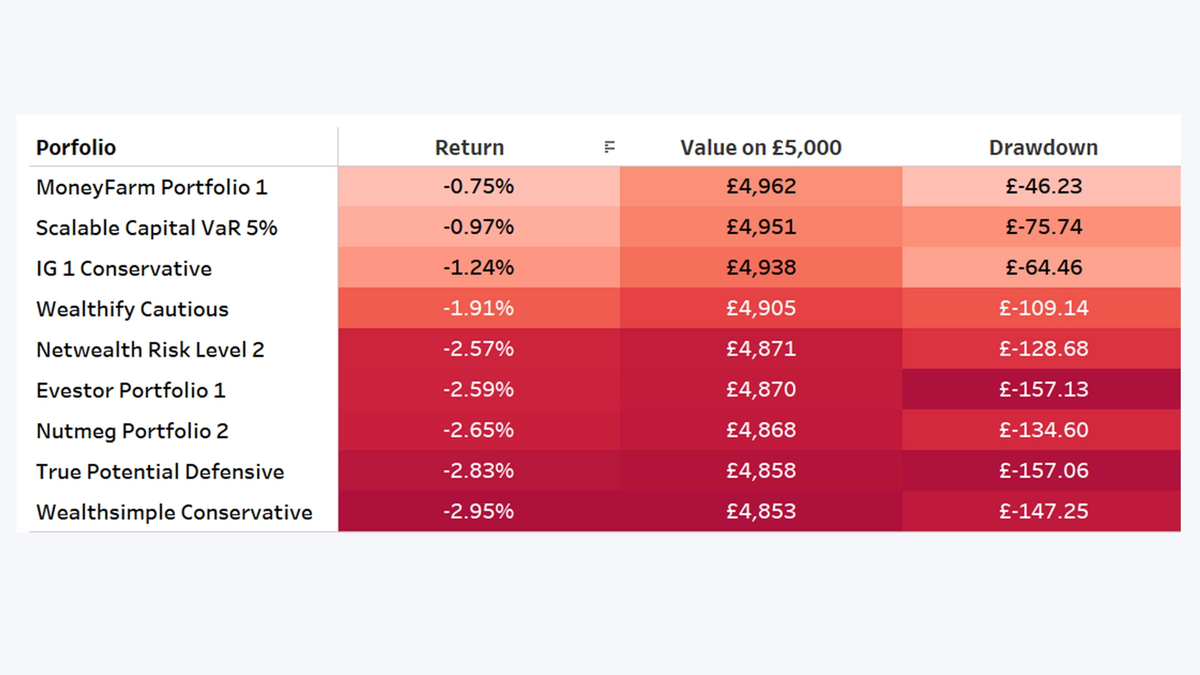
The other side of the coin to return is risk, and an important question is how much risk is taken to achieve returns. The “Drawdown” column shows the most you would have lost in one of these ‘low risk’ portfolios over 2018, assuming you had invested £5,000 at the end of the month where the portfolios were at their highest and taken your money out when they were lowest.
Low risk portfolio return, risk-adjusted return, and drawdown over the 12 months to 31st December 2018

Medium risk portfolios
The charts below show what would have happened if you had invested £5,000 over 2017 and 2018.
All the nine robo-advisers have at least a 1-year track record, and seven have at least a 2-year track record.
The 1-year performance looks at what would have happened if you invested from 1st January 2018 to 31st December 2018. The 2-year performance looks at 1st January 2017 to 31st December 2018.
High risk portfolio returns on £5,000 invested up to the 31st December 2018

What is in these portfolios?
A nice thing about robo advisers is that they spread your money around. One single investment from you and your cash is spread into cash, shares, property and more - and across the globe too.
The medium risk portfolios are most evenly spread between bonds and cash and shares - this means you will have experience some bumps in the road but it shouldn't be a rollercoaster.
As a general rule, you would expect equities (that's just another way of saying shares) to be riskier than bonds, which will also be riskier than cash. A riskier asset will typically perform better than a less risky asset over the long term.
Robo-adviser “Medium risk” portfolio asset allocations over the 12 months to 31st December 2018

How much risk did these portfolios take?
The other side of the coin to return is risk, and an important question is how much risk is taken to achieve returns. The “Drawdown” column shows the most you would have lost in one of these ‘low risk’ portfolios over 2018, assuming you had invested £5,000 at the end of the month where the portfolios were at their highest and taken your money out when they were lowest.
High risk portfolio return, risk-adjusted return, and drawdown over the 12 months to 31st December 2018

High risk portfolios
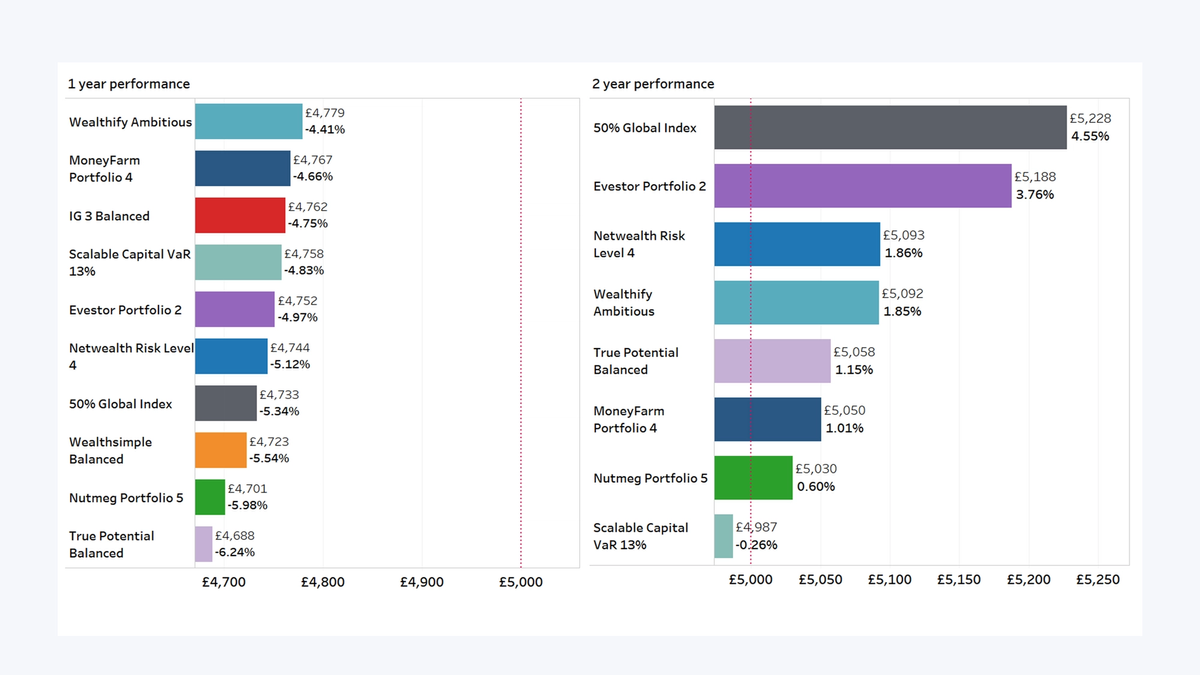
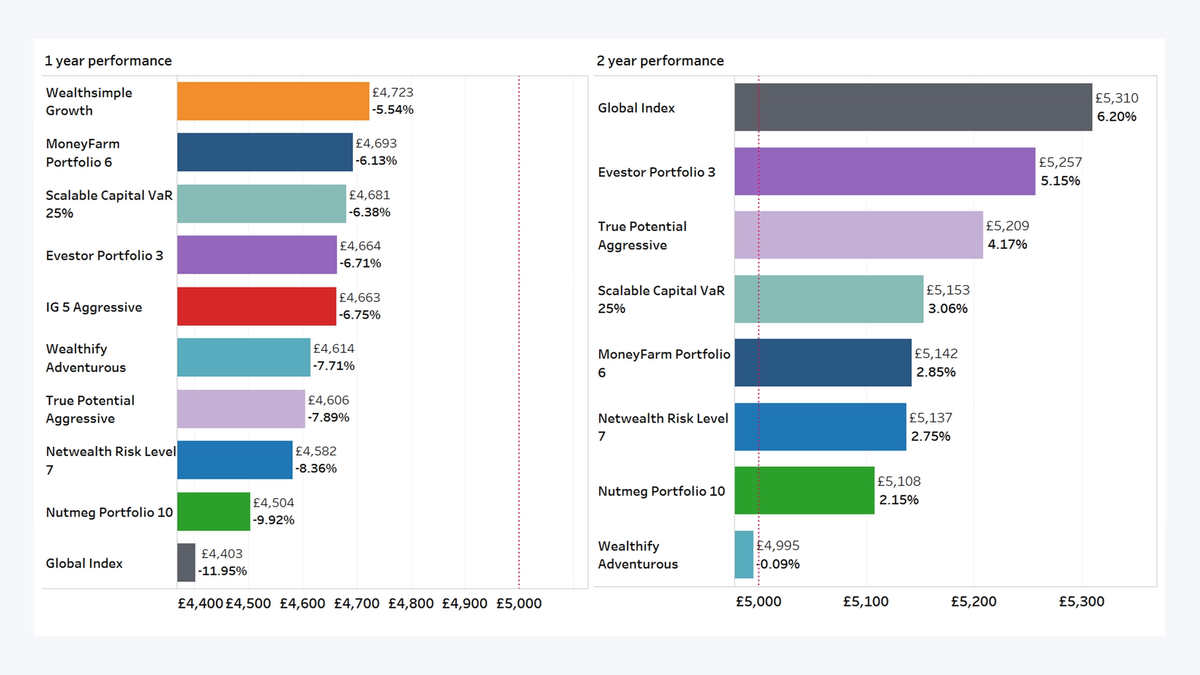
The charts below show what would have happened if you had invested £5,000 over 2017 and 2018.
All the nine robo-advisers have at least a 1-year track record, and seven have at least a 2-year track record.
The 1-year performance looks at what would have happened if you invested from 1st January 2018 to 31st December 2018. The 2-year performance looks at 1st January 2017 to 31st December 2018.
High risk portfolio returns on £5,000 invested up to the 31st December 2018

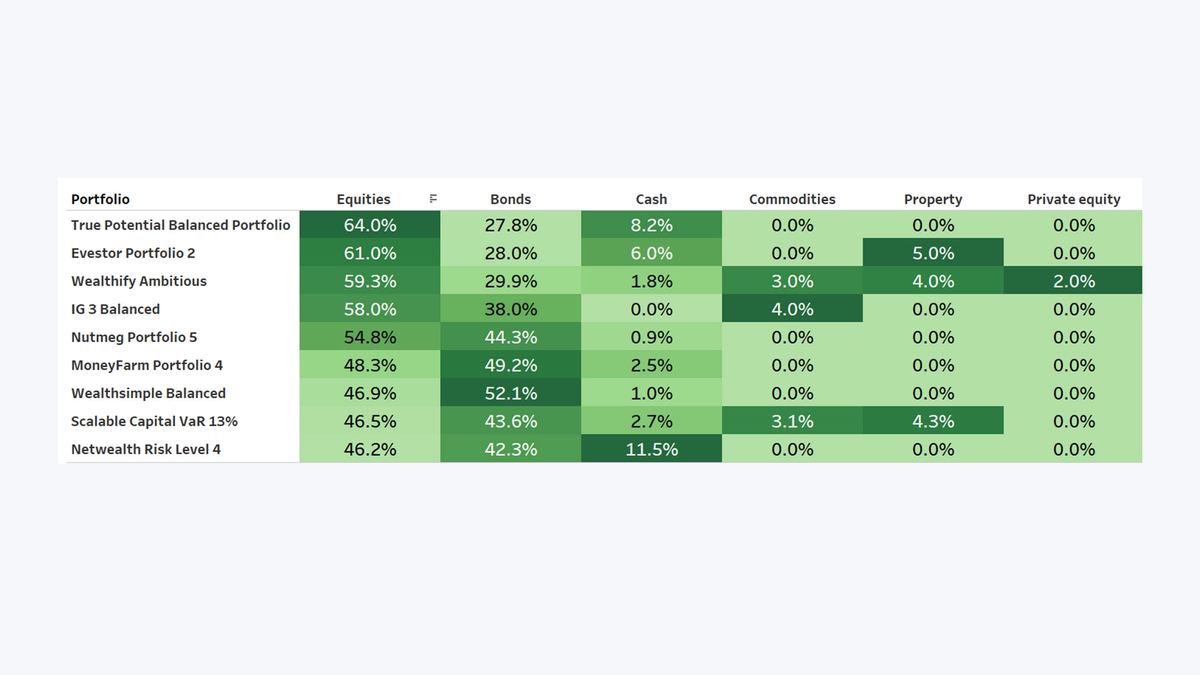
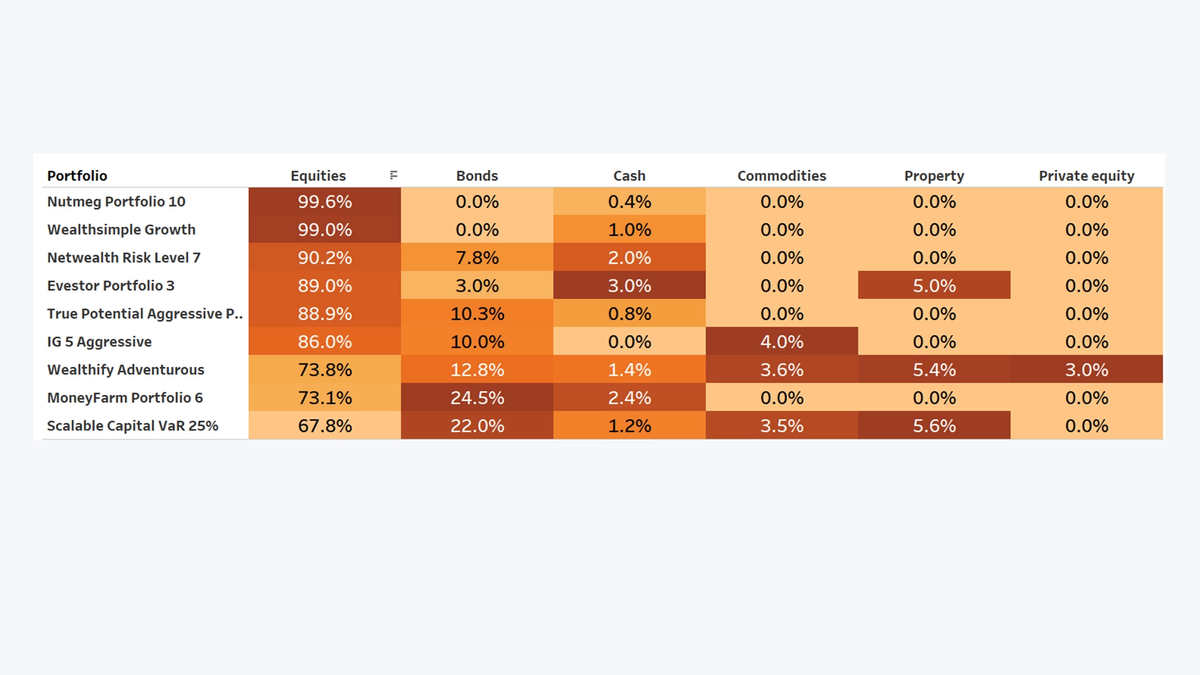
What is in these portfolios?
A nice thing about robo advisers is that they spread your money around. One single investment from you and your cash is spread into cash, shares, property and more - and across the globe too.
The higher risk portfolios will have mostly shares inside - this means you are prepared for a relatively bumpy ride and you won't panic about falls in any one year as this is at least a 5 year + decision. You would expect to see years where this goes backwards, but expect things to grow more over the long-term.
As a general rule, you would expect equities (that's just another way of saying shares) to be riskier than bonds, which will also be riskier than cash. A riskier asset will typically perform better than a less risky asset over the long term.
As always this is not guaranteed. But the key is really to make sure you will not freak out when the Daily Mail shrieks about stock market corrections and falls. It's par for the course.
Robo-adviser “High risk” portfolio asset allocations over the 12 months to 31st December 2018

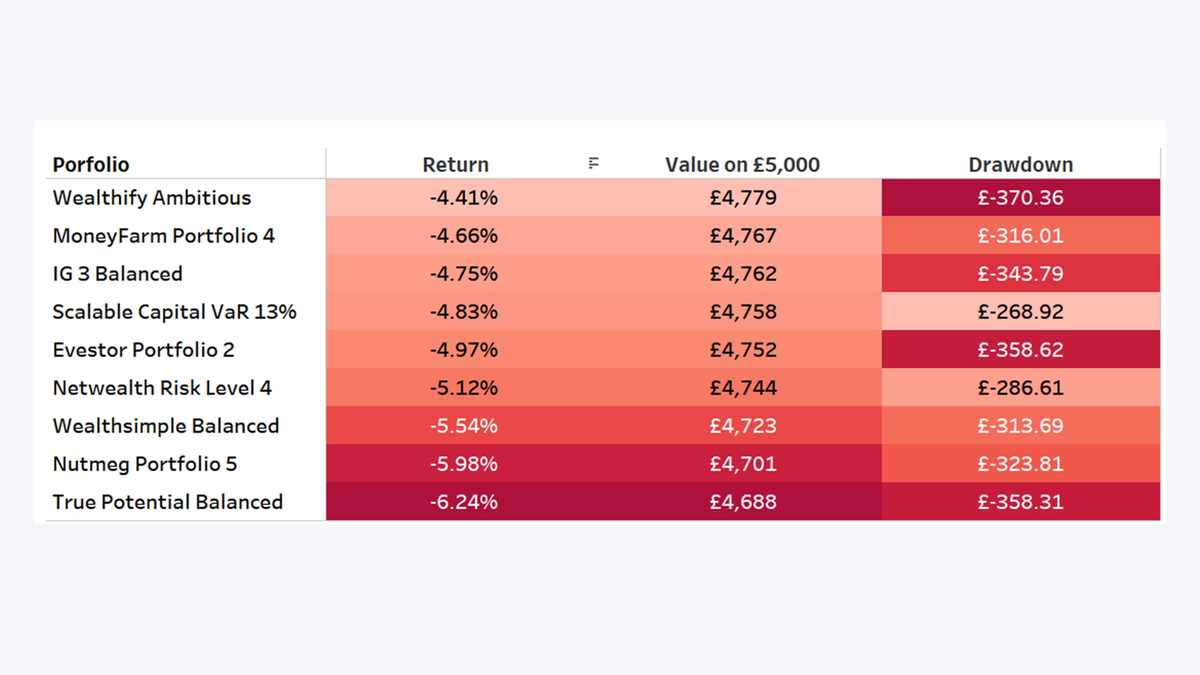
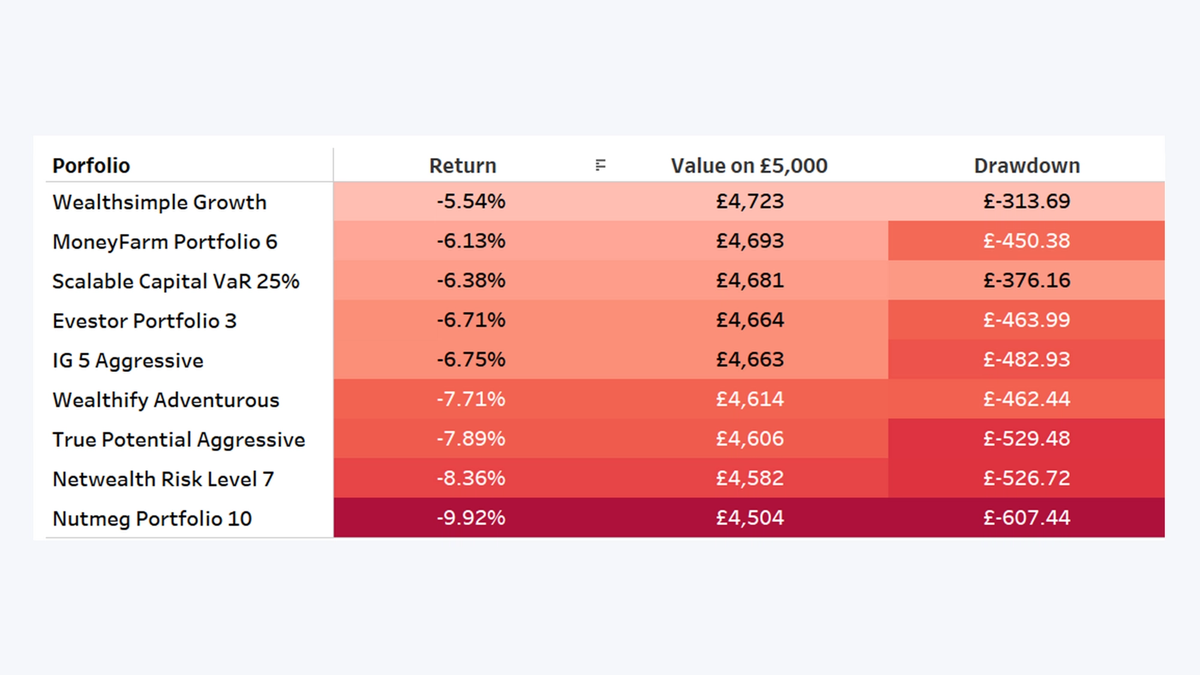
How much risk did these portfolios take?
The other side of the coin to return is risk, and an important question is how much risk is taken to achieve returns. The “Drawdown” column shows the most you would have lost in one of these ‘low risk’ portfolios over 2018, assuming you had invested £5,000 at the end of the month where the portfolios were at their highest and taken your money out when they were lowest.
High risk portfolio return, risk-adjusted return, and drawdown over the 12 months to 31st December 2018

You may also like...