Top performing ready-made investments of the last 2 years
20 Jan, 2023

Today we announce the performance of leading robo advisers and ‘ready-made’ investments on major platforms, over the last 2 years. We share these numbers after fees, so it reflects what us end investors see.
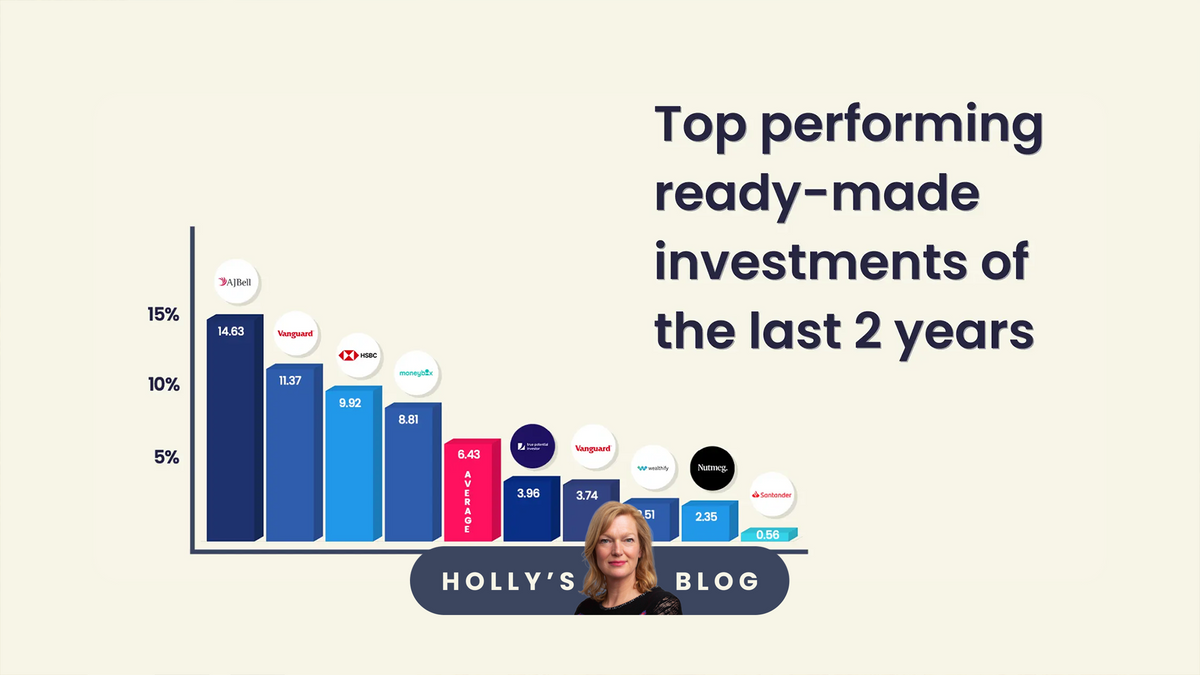
I’ve been doing this for a long time now and you start to see trends. AJ Bell, Vanguard, HSBC and Moneybox have done consistently well across the board over recent years.
What does good look like?
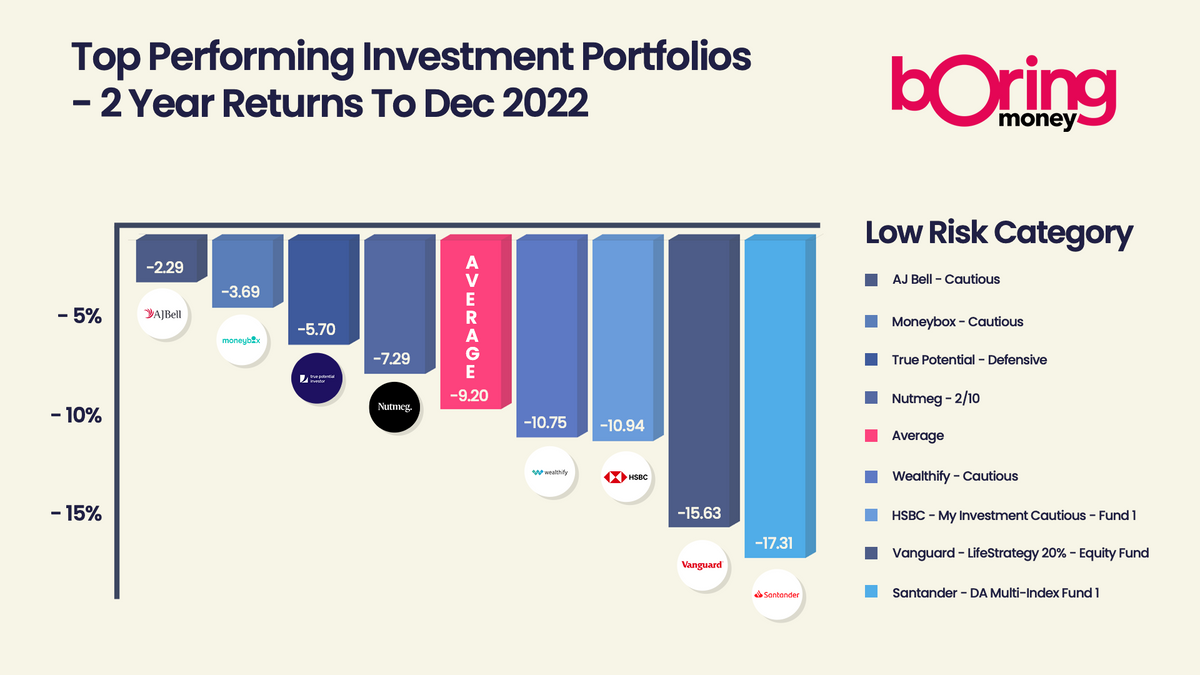
It’s been a torrid old time. The higher-risk stuff (which just means bundles of investments with more shares than typically calmer bonds) did the best. The average high-risk portfolio has gone up by 6.4% over the 2 years; the medium-risk ones have fallen by 2.6% and the so-called low-risk portfolios have fallen by an average of 9.2%.
You don’t have to be an empathetic genius to work out that people across the board who opted for the lowest-risk option will be wondering what hit them.
In a word – bonds. Not to be confused with premium bonds- as they often are - bonds are the boring cousins of shares and are supposedly lower risk investments which are effectively IOUs from investors to companies or Governments, in return for some interest and the chance they will also go up in value.
Their job is to be boring. But in 2022, as any mortgage customer knows, people’s beliefs about what would happen to interest rates in the future – and mass uncertainty unleashed by THAT mini-Budget – sent everything into a panic. This was unusual behaviour. It knocked the bond markets and I hope that we don’t see people turn their back on investing for good because of it.

But why did some providers do so much better than others?
There’s a pretty sizeable gap between different providers’ portfolios with similar descriptions. Let’s take the Vindaloo, or High Risk portfolios, for example. Why did some do so much better?
In part, this is down to the %s allocated to shares. We’ve tried to group like-with-like, but some have nearer 100% in shares, others nearer 80%. Santander is a very conservative group, for example, and the very highest risk option they offer customers only has about 70% in shares. This has made their 2-year numbers look relatively limp. But guess which option did the best in Q4 out of the 27 options we cover? The Santander Multi-Index 4, which went up by over 5% in the last three months of 2022.
So not all Vindaloos have the same spice – look at the % in shares if you’re doing some digging.
But there are three other main contributors…
The main reasons for the difference in performance across the board are:
What flavour of bonds did people have? (Clue: Those that had lots of UK stuff did worse – and the decisions between short-term versus long-term bonds were also important)
Did they ‘hedge’ against currency ups and downs? (Clue: Those that did, did worse because the US dollar rode high)
How much they had in energy/ oil and gas sectors (Clue: Those that went large here did better!)
Two years is not enough to categorically evidence skill over luck, but it does give us a flavour. If we look back over three years, we actually see a very similar picture in terms of who did well.
But we should also remember that markets are fluid beasts. The last three months of the year performed radically differently, so some of the worst afflicted in our 2-year picture had a good quarter. You can see the Q4 numbers as well as the 2-year numbers in this summary table. Time will evidence which providers are more adept at tweaking things in response to what’s going on around them.
Nerd alert – this tweaking is called ‘tactical asset allocation.’ It’s like that maddening thing a hairdresser does to women after the main cut -they do that awful final faff for 10 minutes to get it “just so”, at which point I am normally wriggling in my chair in anguish, dying to escape. “Ooh, let’s take a millimetre off energy stocks; maybe put a touch of spray on the US dollar?”.
Longer-term decisions which tend not to change much are the ‘strategic asset allocation’. How much is in shares or bonds, etc? This is like saying “I’ll have 2 inches off, please”. It’s the basic cut.
You can see all the detail and numbers for the high-risk portfolios, the medium-risk portfolios, the low-risk portfolios or the whole lot together here.
Saving money tips
In other news, we ran a webinar this week with Standard Life and looked at loads of different ways to save money, budget, cut tax bills and make decisions about your pension, as the cost of living bites.
There were tons of great tips and you can read the highlights here. From childcare benefits (e.g. if one parent doesn’t work, make sure the non-working parent is claiming the benefit for NI credits), to a benefits check calculator, pensions tips, marriage tax allowance, favourite budgeting apps and more, I hope there’s something for everyone.
Ladies – as part of our Visible! content, we have a few spots left in the online workshops which advisers are running in the coming weeks to help with financial questions on divorce and planning for parents (IHT, care home fees, etc).
And we can also announce our upcoming webinar where I get to chat to Ben Rogoff, who runs the Polar Capital Technology Trust – such an interesting time for this sector -so do pop that in your diaries and we’ll grab your questions to put to Ben!
Have a lovely weekend everyone. It’s January. It’s bloody freezing. The energy bills have arrived. And it’s tax time. YAYYY!!!
Holly