2024 ETF market hits record high: Technology giants drive unprecedented growth
By Boring Money
3 Dec, 2024
It's been another bumper year for the ETF sector, with flows into the market hitting all-time highs. Investors continue to be drawn to ETFs as a cheap and easy way to get exposure to the US equity market, which continued to show strength in 2024. In particular, the technology giants powered ahead, driving returns from major indices such as the S&P 500 and MSCI World, and the popular ETFs that are based on them.
Morningstar data shows the extent of ETF popularity over the year. The ETF and ETC (exchange-traded commodity) markets gathered €27.3bn (£22,7bn) in October alone, the best month ever recorded. The total for the year is now €188.3bn (£156.8bn), around €30bn than the annual all-time record in 2021 – and the year isn’t over yet.[1] Assets in ETF funds are now more than €2 trillion.
The driving force for the recent strength of ETFs has been the performance of larger capitalisation stocks across the world. The indices on which ETFs are based tend to be market capitalisation weighted, meaning ETFs have the greatest exposure to these top performers.
The strength has been self-perpetuating. Strong performance from large companies has attracted more investment, which has pushed up prices, which has attracted more investment. In the US, the mega-cap champions have been technology giants such as Nvidia, Apple, Meta, or Amazon - the so-called "Magnificent Seven"; in Europe, it has been ASML or Novo Nordisk; in Asia, it has been TSMC.
The US mega-caps continued to dominate the headlines for much of the year. Although investors worried over rising valuations, the companies delivered strong earnings, and their share prices went from strength to strength. Nvidia’s share price has risen 173% since the start of the year.[2] Collectively, the Magnificent Seven have delivered returns of 52.8%.[3]
These seven stocks are all top 10 weightings in the S&P 500, and have helped fuel its growth over the year. The index is up 21% for the year-to-date in GBP terms. This is after a decade where the annualised return from the S&P 500 is 13%.[4] The MSCI World also has a significant weighting to the US and to these technology giants. It has risen 16.9% for the year to date (in USD terms).[5]
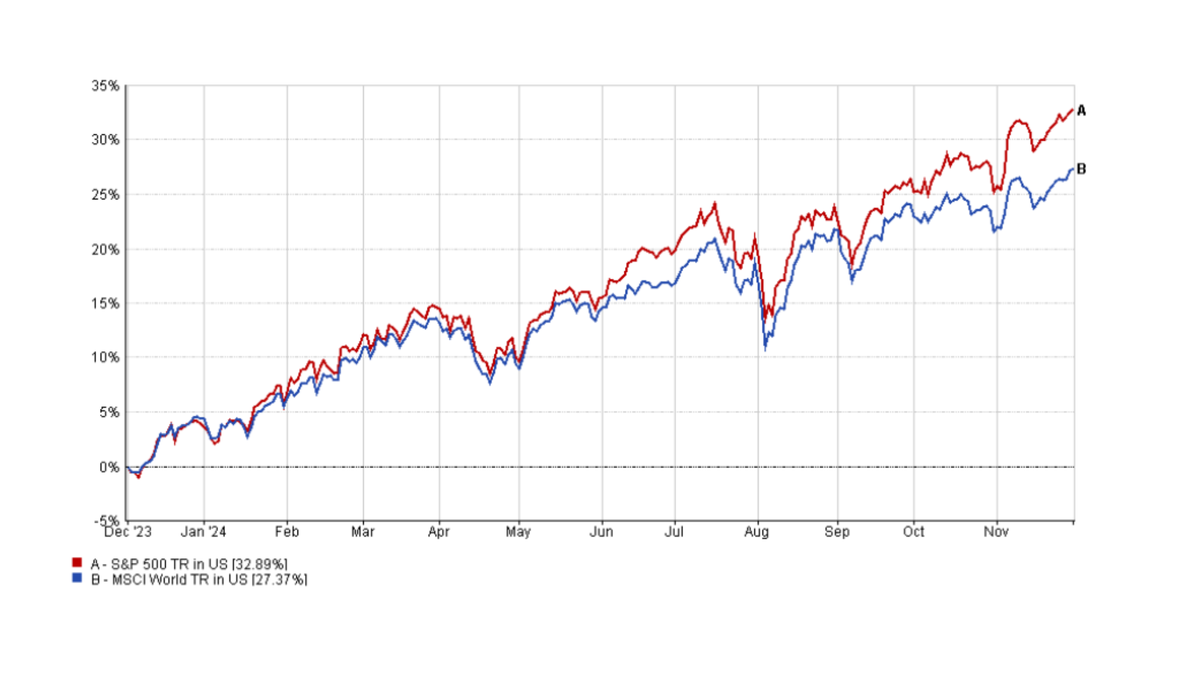
Source: FE fundinfo
Jose Garcia Zarate, Associate Director for Passive Strategies at Morningstar, says:
2024 has been a year when investors have placed the bulk of their money into equity products with a heavy US bias, where passive funds have become the default option.

Comparison to active funds
Investors may have been drawn to ETFs by this strong performance. However, it is worth noting that the average active fund has actually outperformed the S&P 500 for the year-to-date. The average fund in the IA North America fund is up 25.5% in 2024. However, the same is not true for the average global fund, which lags the MSCI World over the year. The average fund in the IA Global sector is up 15.1%, while the average global equity income fund (which tends to have a lower weighting in the technology sector) is up 13.4%.
Equally, not all indices showed strength over the year. The FTSE 100, for example, delivered a lacklustre 7.2% for the year to date. The average UK All Companies fund and UK Equity Income fund has delivered a stronger performance.[6] This partly reflects a recovery in smaller and mid-sized companies, which are not represented in FTSE 100-based ETFs, and only lightly in FTSE All Share-based ETFs, but are a natural hunting ground for active managers.
In its most recent Market Intelligence report, Bfinance says that the strength of active funds is starting to build momentum: “Active equity managers saw their relative returns improve in the altered market conditions of Q3: 50% of developed markets active manager outperformed their benchmarks net of fees in the third quarter, thanks to a shift in style drivers.”[7]
Different return profile
In certain parts of the market, 2024 has exposed the different return profile between ETFs and their active fund peers. This was particularly evident in emerging markets, where the MSCI Emerging Markets Index has significantly outpaced active funds. The MSCI EM is up 25.3% for the year to date, while the average fund in the IA Global Emerging Market sector has returned just 9.3% on average.
The main reason for this appears to be that many active funds have had a lower weighting to China, which is still significantly represented in the major emerging market indices and therefore in ETFs. 27.4% of the MSCI EM index is in China, for example.[8] China has rallied this year on the back of its stimulus package, which has helped flatter performance of index funds over active funds.
However, it is worth noting that active funds have helped minimise volatility in previous years and have generally done a better job at protecting capital. They helped minimise losses in 2022, a disastrous year for emerging market indices. The average fund fell 12.2%, compared to a 20.1% fall in the index.[9][10] In this way, the return profile for active over passive is different, and the right choice will depend on the individual investor.
Fixed income
Bfinance says that fixed income ETFs have generally been weaker than their active equivalent. There can be structural difficulties with passive fixed income investments – any market capitalisation weighted index will tend to have the highest weighting in the largest issuers – i.e. those companies or governments with the highest debt levels. Equally, fixed income markets have been volatile, as interest rate expectations have bounced around, which has been a fertile environment for active managers.
Bfinance says: “Active fixed income managers have delivered strong relative returns over the past five years; US Investment Grade managers, for example, delivered outperformed by 40bps net of fees over the five-year period, and Euro Investment Grade managers outperformed by 30bps net of fees.” The climate has been unusual, however, and it may be that a more settled interest rate regime reverses this trend.
The popularity of ETFs shows no signs of abating, and while the US stock market – and its flagship technology sector in particular – continues to power ahead, it is difficult to see flows reversing. There are areas where active management has delivered better returns for investors or a differentiated return profile. 2024 has once again made the case for both approaches in a portfolio.
---
[1] Morningstar, November 2024
[2] Marketwatch, November 2024
[3] CNBC, November 2024
[4] SNP, November 2024
[5] MSCI World, November 2024
[6] Trustnet, November 2024
[7] Bfinance, November 2024
[8] MSCI Emerging Markets index, November 2024
[9] Trustnet, November 2024
[10] MSCI Emerging Markets index, November 2024