




Best-selling funds, Investment Trusts and ETFs of October 2025
Discover the most popular investments on the UK's top platforms
By Boring Money
11 Nov, 2025
Every month, Boring Money conducts rigorous research on what the best-selling investments were across the UK's major investment platforms - including AJ Bell, Fidelity, Hargreaves Lansdown and interactive investor.
Boring Money's expert analysis
Global stock markets shrugged off the impact of a US government shutdown in October, with lower inflation raising hopes of further interest rate cuts. The An index that tracks the performance of the 500 largest publicly traded companies in the United States. It's often used as a benchmark for the overall global stock market. hit new highs, reaching 6,890 at its peak[1]. Investors were rewarded with another rate cut at the end of the month, with the Federal Reserve lopping another 25bps from borrowing costs.
However, US markets noticeably lagged other markets. The S&P rose 2.3% over the month, but the MSCI Emerging Markets index saw gains of 4.2% over the same period[2]. The growth was driven by renewed strength in the Indian market, plus strong gains in AI-related markets such as Taiwan and South Korea.
Across the US and other AI-focused markets, there has been a growing drumbeat of concern over AI and the extent to which it is driving global economic growth. Calastone fund flow data revealed June to September as the worst quarter on record for Another word for shares or stocks. fund outflows, with UK investors “running scared of sky-high stock markets”. £3.64bn was withdrawn over the period.
The Bank of England and the IMF have both warned on frothy AI valuations and made parallels with the Dotcom boom of the late 1990s. Even OpenAI boss Sam Altman said there were parts of the market that “could be seen as bubbly right now”[3]. However, markets only started to wobble at the start of November.
The Large cap (short for "large capitalisation") refers to companies with a large market capitalisation, typically those valued at £7.5 billion or more. end of the UK market continued its surprising run of strength. The Also called “Footsie”, the name for the share index made up of the largest 100 companies by market capitalisation (total value of all shares) listed on the London Stock Exchange. 100 rose 2.9% over the month to hit new highs. Ongoing speculation about the budget and which taxes the Chancellor might raise continued to weigh on the Firms outside the FTSE 350, typically in the FTSE SmallCap index, market capitalisation from several hundred million up to around £2bn and A company valued between £2 billion and £10 billion. Its shares sit between those of small‑cap (smaller companies) and large‑cap (big companies), usually offering a mix of growth potential and stability.. The Similar to the FTSE 100 and includes the largest companies on the London Stock Exchange by market capitalisation, excluding the initial 100 largest from the FTSE 100. In other words, it's the 101st to the 350th largest companies on the London Stock Exchange. rose 0.7% over the month, while the FTSE Small Cap rose 1.9%. The Bank of England’s decision to keep interest rates on hold was another factor weighing on the market.
One small piece of good news for both investors in UK A gilt is a fixed income bond issued by the UK government. They are so named because, historically, the paper certificates used to issue these bonds had a gilt (gilded) edge. The government issues gilts in order to fund public spending. and the Chancellor was the decline in gilt The return or profit on an investment, usually expressed as a percentage of the total price per year. For example, if the yield on a bond was 5%, this means an investor with £100 in that bond would get £5 in returns per year. over the month. The yield on the 10 year gilt started the month at around 4.7%, but had dropped as low as 4.4% by the end. The spur appeared to be weaker inflation data. While the A widely-used measure of inflation, it is used to represent the average change in prices across a range of goods and services that are typically purchased by UK households - for example, food and clothing. rose at 3.8% in September, it was below market expectations of a 4% hike. The Bank of England also said that it considered inflation to have peaked.
There were some cracks in the precious metals story over the month. The gold price dropped significantly in the second half of October, falling from 4,350 to below 4,000. The drop was attributed to profit taking after some strong gains, but also the ongoing stabilisation of the dollar. Silver and platinum prices were also weak.
Best-selling funds | October 2025
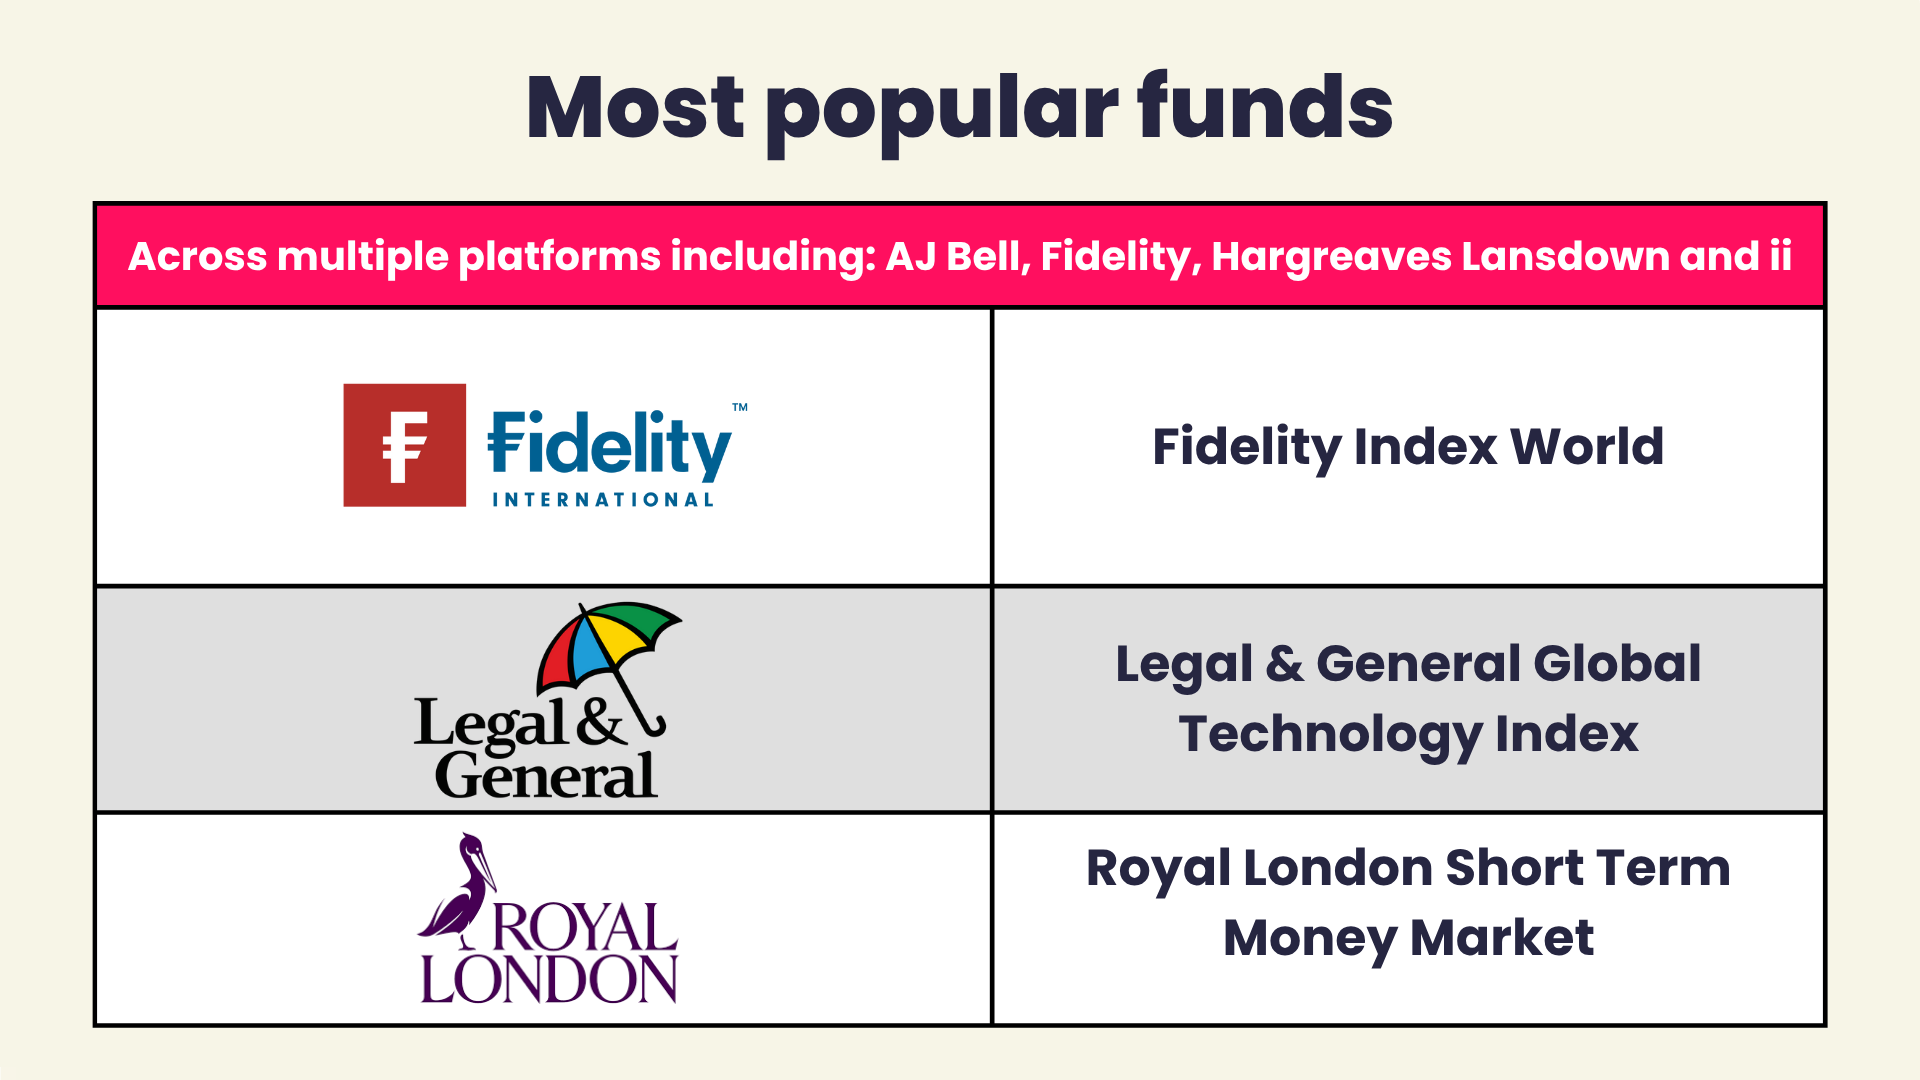
The most popular funds across multiple platforms including AJ Bell, Fidelity, Hargreaves Lansdown and interactive investor were Fidelity Index World, Legal & General Global Technology Index and Royal London Short Term Money Market.
There were some hints of growing nerves over technology in platform sales data over the period. The Royal London Short Term Money Market fund was among the top 10 for fund sales across all four major investment platforms and the top seller on the AJ Bell and ii platforms. On Fidelity, it was only beaten by the Fidelity Cash fund. Half of the top 10 sellers on the Fidelity platform were cash-based funds.
Elsewhere, investors appeared to be looking to take risk off the table. A number of precious metals funds appeared in the mix – Jupiter Gold & Silver on the ii platform, and Ninety One Global Gold fund on Fidelity – in spite of a wobble for precious metals prices in the second half of the month. The Artemis Global Income fund also appeared on two out of the four platforms, as investors sought the cushion of a yield.
There were some old favourites. The Fidelity Index World was still a popular option, appearing across all four platforms, as was the Legal & General Global Technology index. However, the previously ubiquitous S&P 500 trackers were notable in their absence from this month’s best seller list, with none on the AJ Bell, Fidelity, or ii platforms.
Two extra active funds crept onto the lists this month. Canny investors have finally noticed the rally in parts of the UK market since the start of the year. The Fidelity Special Situations fund has delivered an almost identical return to the MSCI World index over the past three years, an astonishing achievement given that one is predominantly invested in US technology and the other is fishing in the much tougher UK market. The Rathbones Global Opportunities fund also made the AJ Bell best-seller list.
Best-selling funds from AJ Bell
Funds | 3 year performance | 5 year performance | Ongoing Charges Figure |
Royal London Short Term Money Market | 15.1% | 16.0% | 0.10% |
AJ Bell Adventurous | 46.6% | 81.8% | 0.31% |
Rathbone Global Opportunities | 49.8% | 54.2% | 0.76% |
AJ Bell Global Growth | 43.9% | 80.0% | 0.31% |
AJ Bell Moderately Adv I Acc | 39.2% | 63.6% | 0.31% |
Fidelity Index World | 58.9% | 105.1% | 0.12% |
Royal London Short Term Money Market Acc | 15.1% | 16.0% | 0.10% |
AJ Bell Balanced | 33.1% | 48.5% | 0.31% |
HSBC FTSE All-World Index | 58.1% | 94.5% | 0.13% |
L&G Global Technology Index | 153.4% | 190.9% | 0.31% |
Performance figures are retrieved from FE FundInfo on a Total Return is a comprehensive way of measuring investment performance that includes two components: capital appreciation/depreciation (changes in the actual price or value of the investment) and income distributions (any dividends, interest payments, or other distributions paid out during the measurement period)..
Best-selling funds from Fidelity
Funds | 3 year performance | 5 year performance | Ongoing Charges Figure |
Fidelity Cash Fund | 14.6% | 15.4% | 0.15% |
Royal London Short Term Money Market | 15.1% | 16.0% | 0.10% |
Fidelity Index World | 58.9% | 105.1% | 0.12% |
Legal & General Cash Trust | 14.7% | 15.5% | 0.15% |
Ninety One Global Gold Fund | 186.9% | 107.4% | 0.86% |
Legal & General Cash Trust I Class Income | 14.7% | 15.5% | 0.15% |
Legal & General Global Technology Index | 153.4% | 190.9% | 0.31% |
Fidelity Special Situations | 58.7% | 130.4% | 0.91% |
Artemis Global Income | 95.6% | 179.7% | 0.87% |
Fidelity Cash Fund | 14.6% | 15.4% | 0.15% |
Performance figures are retrieved from FE FundInfo on a Total Return is a comprehensive way of measuring investment performance that includes two components: capital appreciation/depreciation (changes in the actual price or value of the investment) and income distributions (any dividends, interest payments, or other distributions paid out during the measurement period)..
Best-selling funds from Hargreaves Lansdown
Funds | 3 year performance | 5 year performance | Ongoing Charges Figure |
Artemis Global Income | 95.6% | 179.7% | 0.87% |
Fidelity Index World | 58.9% | 105.1% | 0.12% |
Vanguard FTSE Global All Cap Index | 54.6% | 90.7% | 0.23% |
UBS S&P 500 Index | 60.3% | 118.4% | 0.09% |
Legal & General Global Technology Index | 154.3% | 192.7% | 0.20% |
HSBC FTSE All World Index | 58.1% | 94.5% | 0.13% |
Legal & General International Index Trust | 60.2% | 106.1% | 0.08% |
Vanguard LifeStrategy 100% Equity | 55.4% | 94.2% | 0.22% |
Royal London Short Term Money Market | 15.1% | 16.0% | 0.10% |
Fidelity S&P 500 Index | 77.0% | 108.2% | 0.11% |
Performance figures are retrieved from FE FundInfo on a Total Return is a comprehensive way of measuring investment performance that includes two components: capital appreciation/depreciation (changes in the actual price or value of the investment) and income distributions (any dividends, interest payments, or other distributions paid out during the measurement period)..
Best-selling funds from interactive investor
Funds | 3 year performance | 5 year performance | Ongoing Charges Figure |
Royal London Short Term Money Market | 15.1% | 16.0% | 0.10% |
Vanguard LifeStrategy 80% Equity | 45.4% | 66.4% | 0.22% |
Legal & General Global Technology Index | 153.4% | 190.9% | 0.31% |
Artemis Global Income | 95.6% | 179.7% | 0.87% |
Vanguard FTSE Global All Cap Index | 54.6% | 90.7% | 0.23% |
HSBC FTSE All-World Index | 58.1% | 94.5% | 0.13% |
Vanguard LifeStrategy 60% Equity | 35.9% | 42.5% | 0.22% |
Vanguard LifeStrategy 100% Equity | 55.4% | 94.2% | 0.22% |
Fidelity Index World | 58.9% | 105.1% | 0.12% |
Jupiter Gold & Silver | 170.5% | 114.1% | 1.01% |
Performance figures are retrieved from FE FundInfo on a Total Return is a comprehensive way of measuring investment performance that includes two components: capital appreciation/depreciation (changes in the actual price or value of the investment) and income distributions (any dividends, interest payments, or other distributions paid out during the measurement period)..
Data provided by FE FundInfo, correct as at 31 October 2025.
Best-selling Investment Trusts | October 2025
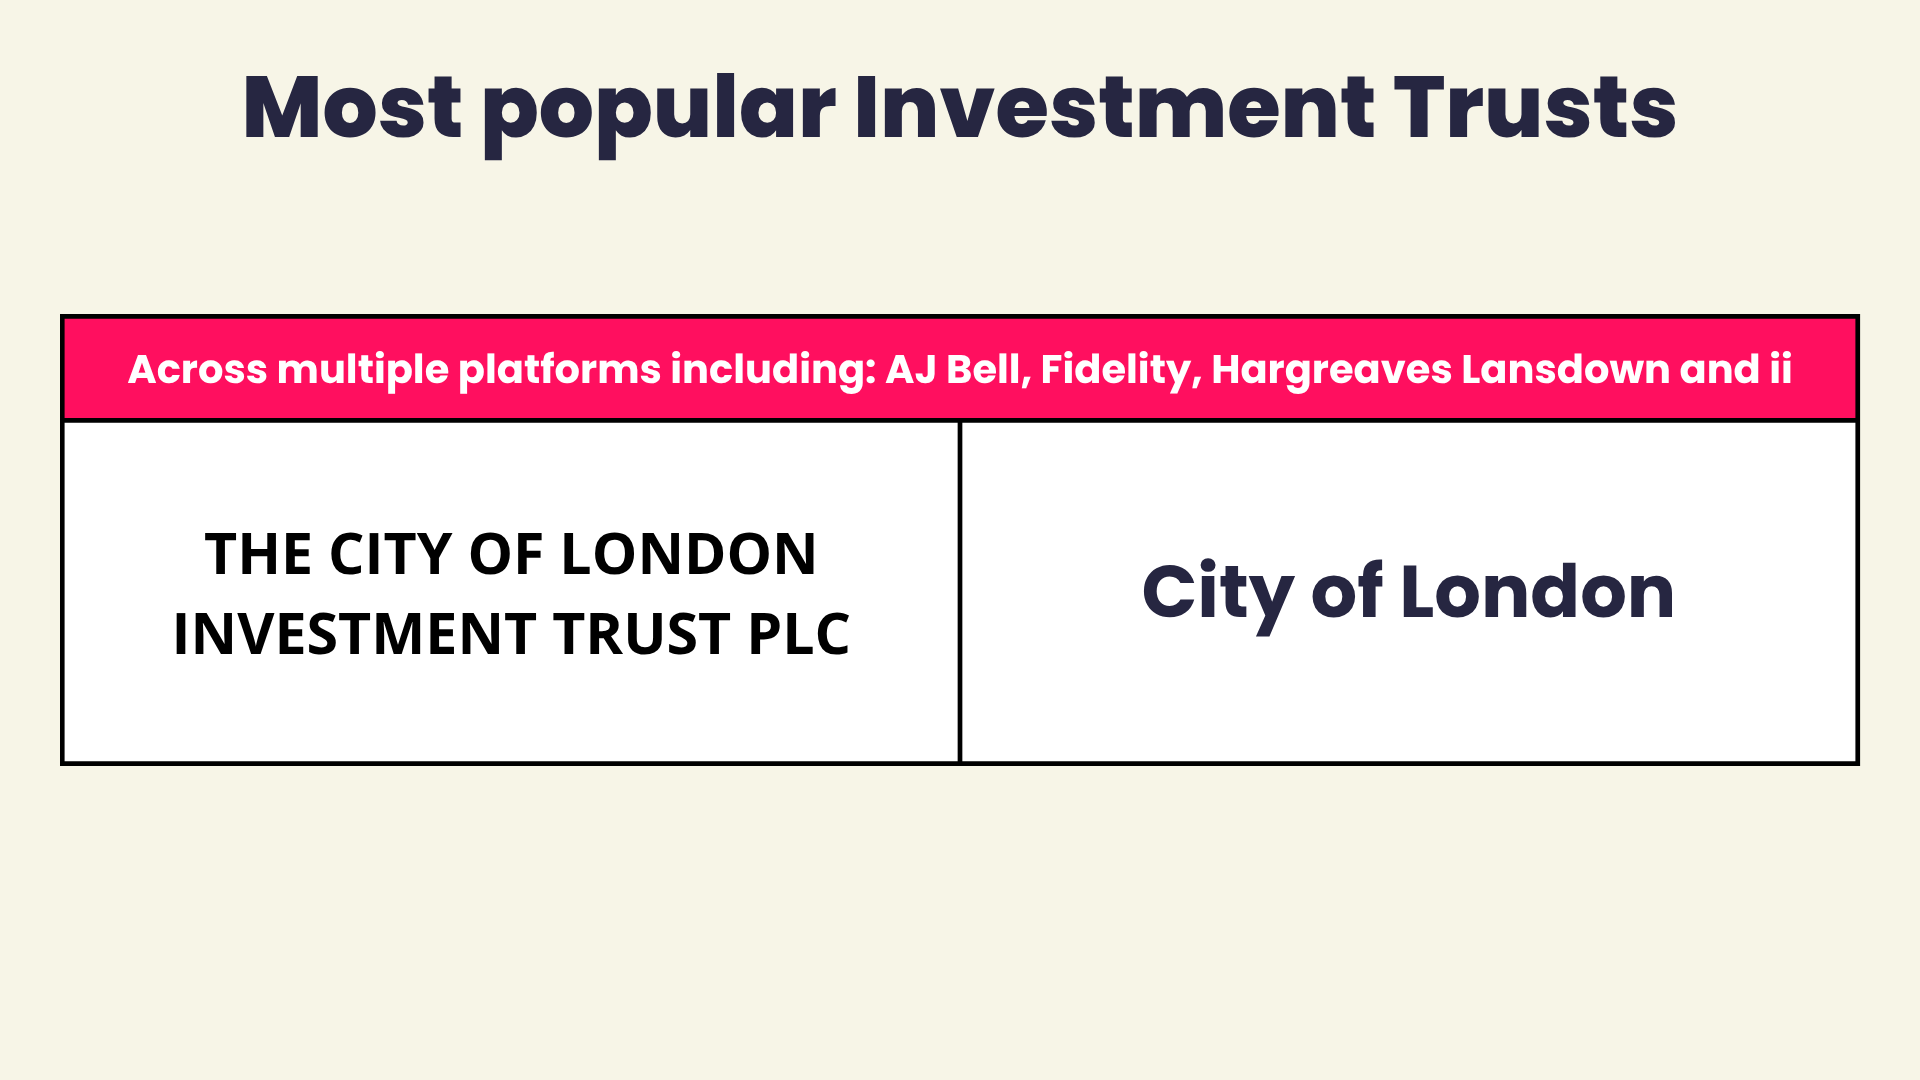
The most popular Investment Trust across AJ Bell, Fidelity, Hargreaves Lansdown, and interactive investor was City of London.
Investment Trust investors continued to expand their horizons in October, moving away from areas such as technology and AI to new areas of potential growth. Although Scottish Mortgage continued to be a best-seller on three platforms, it was a notable absentee on the Hargreaves Lansdown platform. Polar Capital Technology, a previous top seller, was also absent from the HL platform this month.
Asia drew investor attention as investors looked for AI opportunities outside the US. It was a particularly strong month for AI-focused Asian markets such as South Korea and Taiwan. The MSCI Korea rose 22.6% over the month[5], while the MSCI Taiwan rose 9.8%[6]. It was a tougher month for Chinese equities, in spite of a rapprochement with the US on tariffs. Nevertheless, the Fidelity China Special Situations fund was the top seller on the Fidelity platform, while Henderson Far East Income was the top seller on the Hargreaves Lansdown platform. Both funds also appeared on the ii best seller list as well.
Investor enthusiasm for precious metals and mining shares was not dimmed by a wobble in commodity prices in the second half of the month. The BlackRock World Mining fund was a top choice on the AJ Bell platform, while the Golden Prospect Precious Metals fund appears on the ii list.
There was also an urge to diversify. On the Hargreaves Lansdown and ii platforms, renewable energy infrastructure was a popular choice – including NextEnergy Solar, Octopus Renewables Infrastructure, Foresight Solar, and Greencoat UK Wind. European trusts also showed strength, with the Fidelity European trust appearing on both the AJ Bell and Fidelity platforms.
Best-selling Investment Trusts from AJ Bell
Investment Trusts | 3 year performance | 5 year performance | Ongoing Charges Figure |
JPMorgan Global Growth & Income | 54.8% | 108.1% | 0.48%* |
Scottish Mortgage | 63.2% | 20.4% | 0.31% |
BlackRock World Mining Trust Ord | 26.5% | 113.7% | 0.95%* |
Law Debenture Corporation Ord | 56.8% | 150.2% | 0.51%* |
Personal Assets Ord | 17.5% | 29.7% | 0.67% |
Polar Capital Technology | 151.6% | 127.5% | 0.77% |
City of London | 49.4% | 108.2% | 0.37% |
Fidelity European Trust | 59.5% | 96.0% | 0.76%* |
F&C Investment Trust | 44.3% | 94.1% | 0.45% |
HgCapital Trust | 44.2% | 74.6% | 1.40%* |
Performance figures are retrieved from FE FundInfo on a Total Return is a comprehensive way of measuring investment performance that includes two components: capital appreciation/depreciation (changes in the actual price or value of the investment) and income distributions (any dividends, interest payments, or other distributions paid out during the measurement period)..
*Data provided by Morningstar, correct as at 31 October 2025.
Best-selling Investment Trusts from Fidelity
Investment Trusts | 3 year performance | 5 year performance | Ongoing Charges Figure |
Fidelity China Special Situations | 96.0% | -1.8% | 0.89% |
F&C Investment Trust | 44.3% | 94.1% | 0.45% |
Fidelity Special Values | 67.0% | 162.9% | 0.70% |
Fidelity European Trust | 59.5% | 96.0% | 0.76%* |
Scottish Mortgage | 63.2% | 20.4% | 0.31% |
Polar Capital Technology | 151.6% | 127.5% | 0.77% |
City of London | 49.4% | 108.2% | 0.37% |
Allianz Technology | 136.6% | 117.2% | 0.64%* |
Temple Bar Investment Trust | 96.3% | 217.8% | 0.62% |
TwentyFour Income | 47.2% | 54.7% | 0.89%* |
Performance figures are retrieved from FE FundInfo on a Total Return is a comprehensive way of measuring investment performance that includes two components: capital appreciation/depreciation (changes in the actual price or value of the investment) and income distributions (any dividends, interest payments, or other distributions paid out during the measurement period)..
*Data provided by Morningstar, correct as at 31 October 2025.
Best-selling Investment Trusts from Hargreaves Lansdown
Investment Trusts | 3 year performance | 5 year performance | Ongoing Charges Figure |
Henderson Far East Income | 38.4% | 37.0% | 1.09% |
Greencoat UK Wind | -11.8% | 5.4% | 0.95%* |
Temple Bar | 96.3% | 217.8% | 0.62% |
Next Energy Solar Fund | -24.4% | -13.5% | 1.12% |
International Public Partnerships | -0.3% | -1.5% | 1.12% |
Octopus Renewables Infrastructure | -33.6% | -31.1% | 1.21%* |
City of London | 49.4% | 108.2% | 0.37% |
Foresight Solar Fund | -10.9% | 9.5% | 1.18% |
Invesco Bond Income Plus | 35.9% | 31.2% | 0.88% |
JPMorgan European Growth & Income | 88.9% | 150.9% | 0.66%* |
Performance figures are retrieved from FE FundInfo on a Total Return is a comprehensive way of measuring investment performance that includes two components: capital appreciation/depreciation (changes in the actual price or value of the investment) and income distributions (any dividends, interest payments, or other distributions paid out during the measurement period)..
*Data provided by Morningstar, correct as at 31 October 2025.
Best-selling Investment Trusts from interactive investor
Investment Trusts | 3 year performance | 5 year performance | Ongoing Charges Figure |
Scottish Mortgage | 63.2% | 20.4% | 0.31% |
Polar Capital Technology | 151.6% | 127.5% | 0.77% |
Greencoat UK Wind | -11.8% | 5.4% | 0.95%* |
City of London | 49.4% | 108.2% | 0.37% |
Temple Bar | 96.3% | 217.8% | 0.61% |
Golden Prospect Precious Metal | 187.7% | 58.4% | 2.20% |
Henderson Far East Income | 38.4% | 37.0% | 1.09% |
Fidelity China Special Situations | 96.0% | -1.8% | 0.89% |
NextEnergy Solar | -24.4% | -13.5% | 1.12% |
JPMorgan Global Growth & Income | 54.8% | 108.1% | 0.48%* |
Performance figures are retrieved from FE FundInfo on a Total Return is a comprehensive way of measuring investment performance that includes two components: capital appreciation/depreciation (changes in the actual price or value of the investment) and income distributions (any dividends, interest payments, or other distributions paid out during the measurement period)..
*Data provided by Morningstar, correct as at 31 October 2025.
Data provided by FE FundInfo, correct as at 31 October 2025.


J.P. Morgan investment trusts have been providing investors with access to income and attractive growth opportunities for 150+ years. With a wide range of strategies, let our experience and insights guide your portfolio, for whatever lies ahead.
Capital at risk.
Find out more
Capital at risk. A Key Information Document is available.
Best-selling ETFs | October 2025
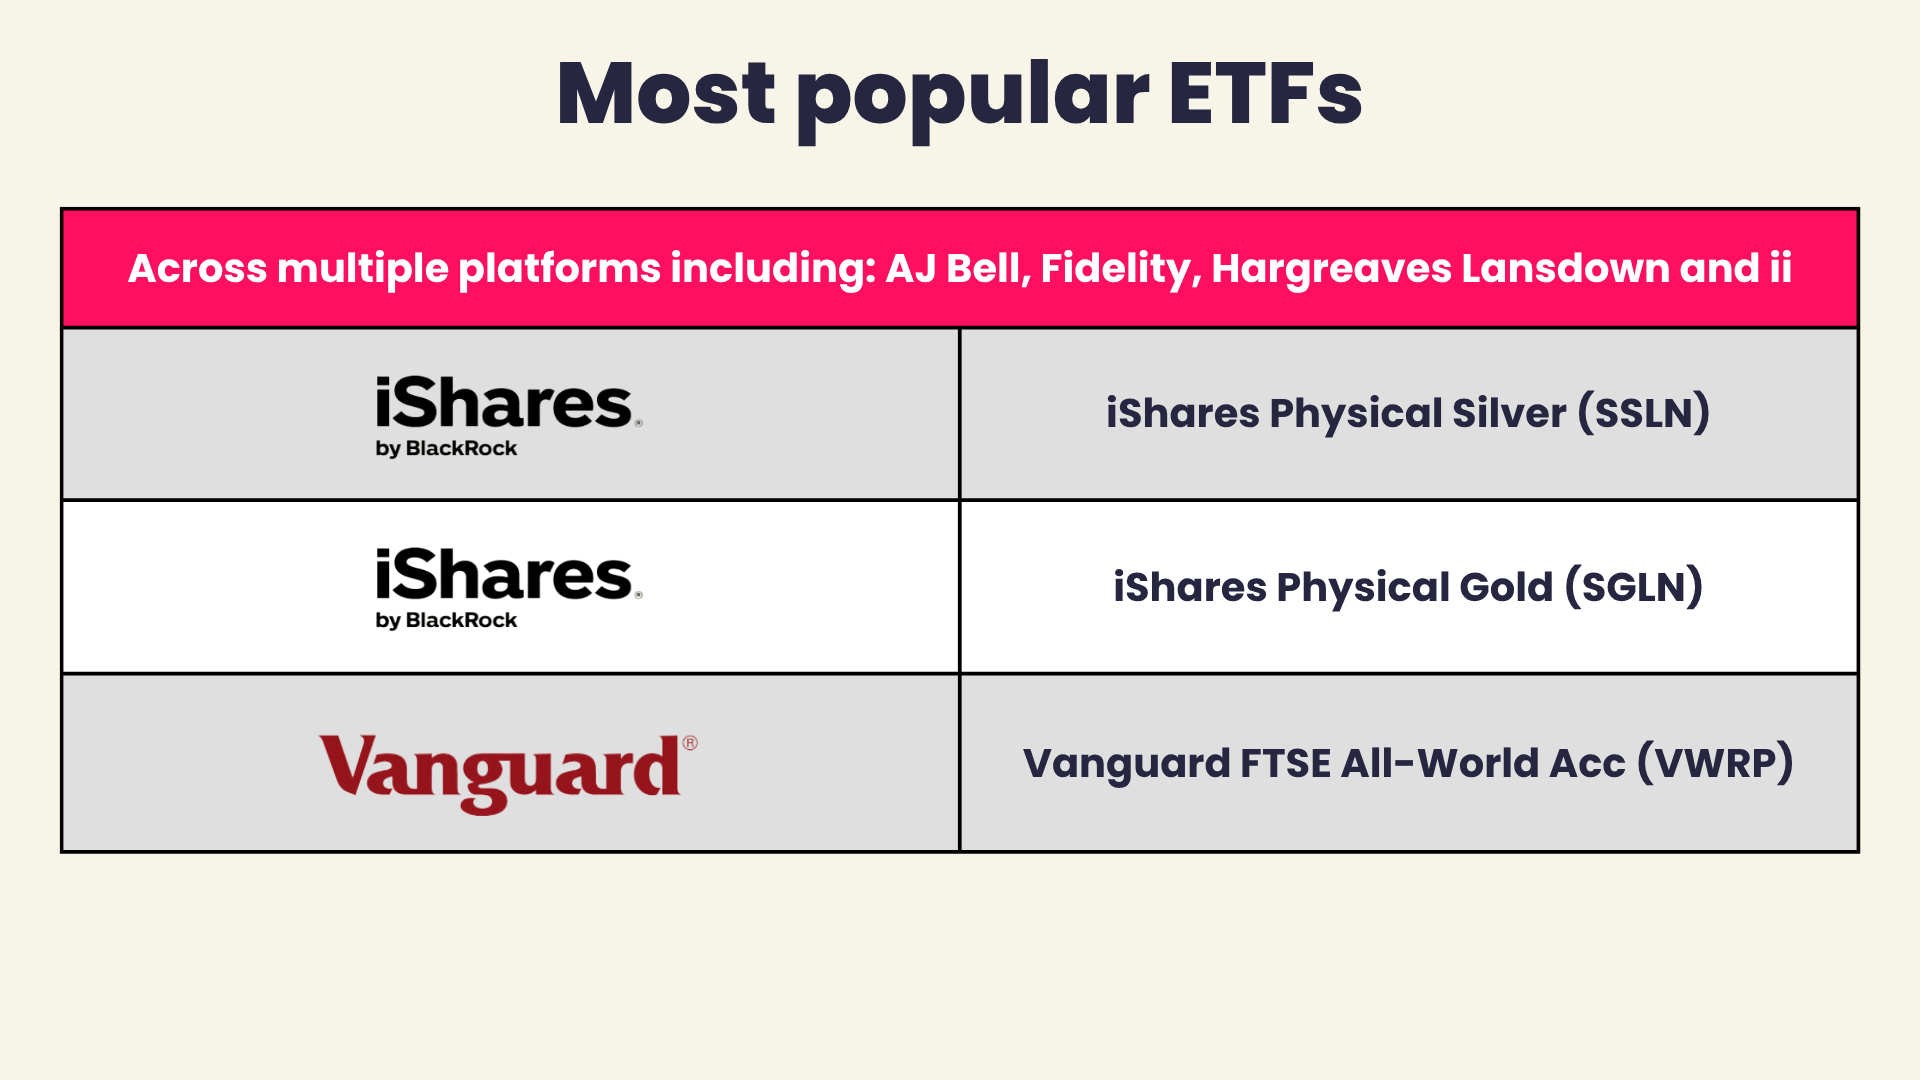
The most popular ETFs across AJ Bell, Fidelity, Hargreaves Lansdown and interactive investor were iShares Physical Silver ETC (SSLN), iShares Physical Gold (SGLN), and Vanguard FTSE All-World Acc (VWRP).
Precious metals continued to be popular with investors. The iShares Physical Gold ETF appeared across all four platforms, as did the iShares Physical Silver ETF. The Global X Silver Miners was also popular on the ii and Hargreaves Lansdown platforms, while the VanEck Rare Earth and Strategic Metals ETF was a top seller on the Fidelity and Hargreaves Lansdown platforms.
ETFs based on the S&P 500 and Nasdaq indices continued to be popular on the AJ Bell platform. The Vanguard S&P 500 UCITS ETF also appeared on the Hargreaves Lansdown and ii platforms. However, there were no US-focused ETFs on the Fidelity platform, and it is notable that the iShares MSCI World ex-USA ETF was a top-seller. This suggests investors may be cooling on US markets.
There is still an appetite for niche parts of the technology industry. The VanEck Uranium And Nuclear Technologies UCITS ETF, Ark Artificial Intelligence & Robotics UCITS ETF, VanEck Defense ETF and VanEck Crypto & Blockchain Innovators ETF were also among the best-sellers.
On the AJ Bell platform, the Vanguard FTSE 250 ETF made an appearance. The UK mid caps have been significantly out of favour, in spite of strength among FTSE 100 companies. The sector now looks very cheap and is due a shift in sentiment. This may be a very early sign that investors are starting to look at UK mid caps again.
Best-selling ETFs from AJ Bell
ETFs | 3 year performance | 5 year performance | Ongoing Charges Figure |
iShares Physical Gold ETC (SGLN) | 114.0% | 108.5% | 0.12% |
Vanguard S&P 500 UCITS ETF GBP (VUSA) | 60.4% | 118.7% | 0.07% |
Vanguard S&P 500 UCITS ETF USD Acc (VUAG) | 60.4% | 118.7% | 0.07% |
iShares Physical Metals PLC Physical Silver ETC (SSLN) | 122.5% | 101.9% | 0.20% |
Vanguard FTSE All-World UCITS ETF USD (VWRP) | 57.6% | 94.4% | 0.19% |
Vanguard FTSE All-World UCITS ETF (VWRL) | 57.6% | 94.4% | 0.19% |
iShares Core S&P 500 UCITS ETF USD (CSP1) | 52.4% | 108.1% | 0.07% |
Invesco NASDAQ 100 UCITS (EQQQ) | 101.1% | 134.7% | 0.30% |
Vanguard FTSE 250 UCITS ETF (VMID) | 36.2% | 48.0% | 0.10% |
Invesco Physical Gold ETC GBP (SGLP) | 113.7% | 108.5% | 0.12% |
Performance figures are retrieved from FE FundInfo on a Total Return is a comprehensive way of measuring investment performance that includes two components: capital appreciation/depreciation (changes in the actual price or value of the investment) and income distributions (any dividends, interest payments, or other distributions paid out during the measurement period)..
Best-selling ETFs from Fidelity
ETFs | 3 year performance | 5 year performance | Ongoing Charges Figure |
iShares Physical Gold ETC (SGLN) | 114.0% | 108.5% | 0.12% |
Vanguard FTSE All-World UCITS ETF USD (VWRP) | 57.6% | 94.4% | 0.19% |
VanEck Crypto& Blockchain Innovators ETF A USD Acc (DAGB) | 347.2% | N/A | 0.65% |
VanEck Defense ETF A USD Acc (DFNG) | N/A | N/A | 0.55% |
iShares £ Ultrashort Bond UCITS ETF GBP (Dist) (ERNS) | 15.9% | 16.8% | 0.09% |
iShares Physical Silver ETC (SSLN) | 122.5% | 101.9% | 0.20% |
iShares MSCI World ex-USA UCITS ETF USD (Acc) (XUSE) | N/A | N/A | 0.15% |
SPDR MSCI All Country World UCITS ETF (ACWI) | 57.8% | 94.9% | 0.12% |
Amundi Smart Overnight Return GBP Hedged UCITS ETF Acc (CSH2) | 15.5% | 16.9% | 0.10% |
VanEck Rare Earth and Strategic Metals UCITS ETF A USD Acc (REGB) | N/A | N/A | 0.59% |
Performance figures are retrieved from FE FundInfo on a Total Return is a comprehensive way of measuring investment performance that includes two components: capital appreciation/depreciation (changes in the actual price or value of the investment) and income distributions (any dividends, interest payments, or other distributions paid out during the measurement period)..
Best-selling ETFs from Hargreaves Lansdown
ETFs | 3 year performance | 5 year performance | Ongoing Charges Figure |
iShares Physical Gold ETC (SGLN) | 114.0% | 108.5% | 0.12% |
Vanguard S&P 500 UCITS ETF USD Acc (VUAG) | 60.4% | 118.7% | 0.07% |
Vanguard FTSE All-World UCITS ETF USD (VWRP) | 57.6% | 94.4% | 0.19% |
iShares Physical Metals PLC Physical Silver ETC (SSLN) | 122.5% | 101.9% | 0.20% |
Vanguard S&P 500 UCITS ETF GBP (VUSA) | 60.4% | 118.7% | 0.07% |
Invesco Physical Markets plc Physical Gold ETC (GBP) (SGLP) | 114.0% | 108.5% | 0.12% |
Invesco FTSE All-World UCITS ETF (FWRG) | N/A | N/A | 0.15% |
VanEck Uranium And Nuclear Technologies UCITS ETF (NUCG) | N/A | N/A | 0.55% |
Ark Artificial Intelligence & Robotics UCITS ETF (ARCI) | N/A | N/A | 0.75% |
VanEck Rare Earth And Strategic Metals UCITS ETF (REGB) | N/A | N/A | 0.59% |
Performance figures are retrieved from FE FundInfo on a Total Return is a comprehensive way of measuring investment performance that includes two components: capital appreciation/depreciation (changes in the actual price or value of the investment) and income distributions (any dividends, interest payments, or other distributions paid out during the measurement period)..
Best-selling ETFs from interactive investor
ETFs | 3 year performance | 5 year performance | Ongoing Charges Figure |
iShares Physical Gold ETC (SGLN) | 114.0% | 108.5% | 0.12% |
Vanguard S&P 500 UCITS ETF USD Acc (VUAG) | 60.4% | 118.7% | 0.07% |
Vanguard S&P 500 UCITS ETF GBP (VUSA) | 60.4% | 118.7% | 0.07% |
iShares Physical Silver ETC (SSLN) | 122.5% | 101.9% | 0.20% |
Vanguard FTSE All-World UCITS ETF (VWRL) | 57.6% | 94.4% | 0.19% |
Global X Silver Miners ETF USD Acc GBP (SILG) | N/A | N/A | 0.65% |
Invesco NASDAQ 100 UCITS (EQQQ) | 101.1% | 134.7% | 0.30% |
Vanguard FTSE All-World UCITS ETF USD (VWRP) | 57.6% | 94.4% | 0.19% |
VanEck Crypto & Blockchain Innovators ETF (DAGB) | 347.2% | N/A | 0.65% |
iShares Core MSCI World (SWDA) | 58.1% | 103.7% | 0.20% |
Performance figures are retrieved from FE FundInfo on a Total Return is a comprehensive way of measuring investment performance that includes two components: capital appreciation/depreciation (changes in the actual price or value of the investment) and income distributions (any dividends, interest payments, or other distributions paid out during the measurement period)..
Data provided by FE FundInfo, correct as at 31 October 2025.
---
[1] S&P Global, November 2025
[2] MSCI World, November 2025 b
[3] BBC, October 2025
[4] Reuters, November 2025
[5] MSCI Korea Index, November 2025
[6] MSCI Taiwan Index, November 2025