Best-selling funds, investment trusts and ETFs of December 2023
Discover the most-bought investments across four major platforms
By Boring Money
12 Jan, 2024
Every month, Boring Money conducts rigorous research on what the best-selling investments were across the UK's major investment platforms - including AJ Bell, Fidelity, Hargreaves Lansdown and interactive investor. Scroll down for the full results and expert insights.
Boring Money's expert analysis
December was a good month for both bonds and equities, capping off a fine 2023. US markets in particular had a strong finish to the year with 4.5% growth in the S&P 500 and 5.6% growth in the more tech-focused NASDAQ.
The FTSE 100 returned 3.7% in December, although the index had another underwhelming year compared to counterparts, most of whom posted double-digit positive returns for 2023. The largest winner in the FTSE 100 during 2023 was Rolls-Royce, with a share price increase of over 200%. Companies with contrasting fortunes include Anglo American and Fresnillo, who dropped 48% and 37% respectively.


Best-selling funds of December 2023
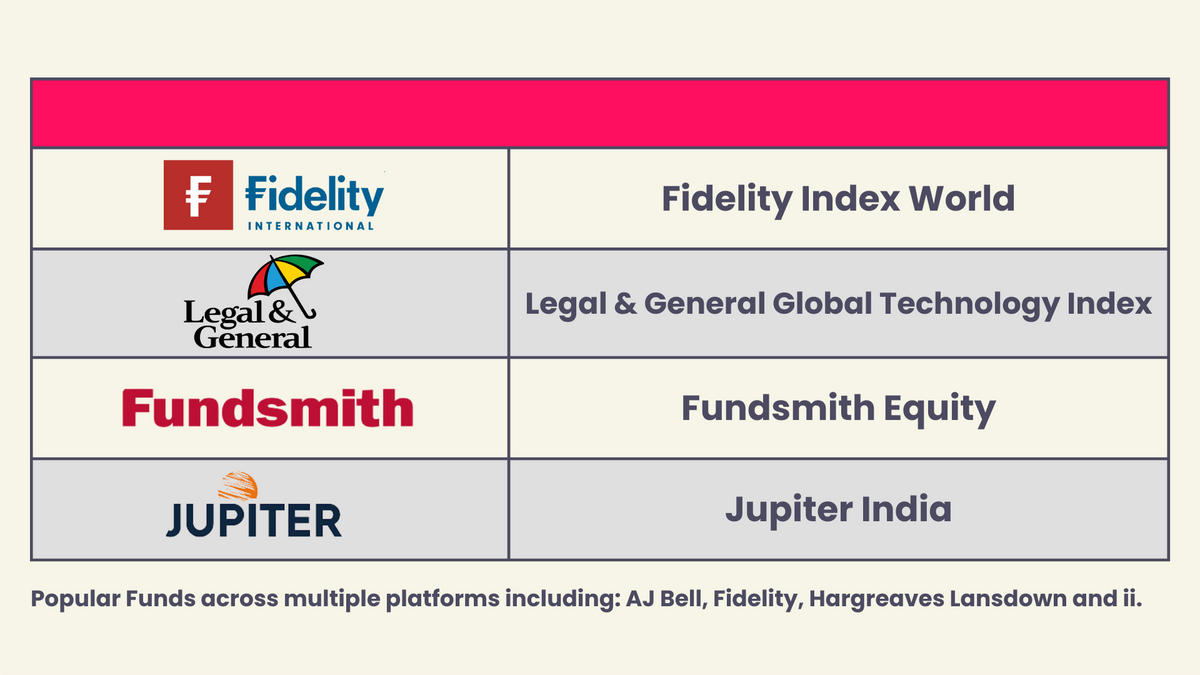
The four most popular funds across multiple platforms including AJ Bell, Fidelity, Hargreaves Lansdown and interactive investor were Fidelity Index World, Legal & General Global Technology Index, Fundsmith Equity and Jupiter India.

Hargreaves Lansdown (HL) are often perceived as the giants of the DIY investing world, as well as one of the most expensive platforms in the market. There are compelling arguments behind both of these beliefs, with HL’s share of the market sitting at over 35%, and its platform charge of 0.45% being significantly higher than competitors like AJ Bell (0.25%) and Fidelity (0.35%). However, this doesn’t always paint the full picture.
HL have negotiated special terms with a variety of investment managers that entitles its customers to discounts and savings on the ongoing charges of some of the funds they offer. 2 of the 4 most commonly purchased funds across multiple platforms in December have lower ongoing charges on HL than other providers.
The L&G Global Technology Index Trust has a different share class on HL compared to other platforms, with a reduced ongoing charge of 0.20%, compared to 0.32% elsewhere. Similarly, the recently popular Jupiter India fund has an ongoing charge of 0.69% on HL, compared to the usual charge of 0.99%. This makes holding the fund cheaper on HL than AJ Bell, for example, despite the higher platform charge.
interactive investor is the only provider from the 4 covered in this list that has a fixed monthly fee, instead of charging a % fee based on the value of your portfolio. Naturally, this tends to be more cost-effective for larger portfolio sizes and more expensive for smaller portfolios.
You can compare and read full, in-depth reviews of all 4 of the providers we’ve mentioned on our comparison tables.
Best-selling funds from AJ Bell
Funds | 3 year performance | 5 year performance | Ongoing Charges Figure |
AJ Bell Adventurous | 23.79% | 57.19% | 0.31% |
AJ Bell Moderately Adventurous | 17.60% | 46.29% | 0.31% |
AJ Bell Global Growth | 20.81% | 56.08% | 0.31% |
Fidelity Index World | 33.29% | 84.50% | 0.12% |
AJ Bell Balanced | 13.78% | 40.19% | 0.31% |
Fundsmith Equity | 18.63% | 76.65% | 0.94% |
Vanguard LifeStrategy 100% Equity | 26.75% | 64.48% | 0.22% |
AJ Bell Responsible | 12.11% | N/A | 0.45% |
Vanguard LifeStrategy 80% Equity | 16.71% | 48.37% | 0.22% |
Vanguard FTSE Global All Cap | 25.51% | 71.63% | 0.23% |
Best-selling funds from Fidelity
Funds | 3 year performance | 5 year performance | Ongoing Charges Figure |
Fidelity Index World | 33.29% | 84.50% | 0.12% |
Fidelity Funds - Global Technology | 48.18% | 191.17% | 1.04% |
Fidelity Cash Fund | 5.87% | 6.84% | 0.15% |
Legal & General UK Index Trust | 27.45% | 36.79% | 0.10% |
Legal & General Global Technology Index | 49.41% | 196.80% | 0.32% |
Fidelity Index US Fund | 42.64% | 105.07% | 0.06% |
Royal London Short Term Money Market | 6.22% | 7.28% | 0.10% |
Fundsmith Equity | 18.63% | 76.65% | 0.94% |
Fidelity Global Special Situations Fund | 18.82% | 71.07% | 0.91% |
Jupiter India | 86.41% | 77.81% | 0.99% |
Best-selling funds from Hargreaves Lansdown (in alphabetical order)
Funds | 3 year performance | 5 year performance | Ongoing Charges Figure |
Artemis Corporate Bond | -7.02% | N/A | 0.37% |
Fidelity Global Technology | 48.18% | 191.17% | 1.04% |
Fidelity Index World | 33.29% | 84.50% | 0.12% |
iShares US Equity Index | 39.49% | 105.72% | 0.06% |
Jupiter India | 88.07% | 80.65% | 0.69% |
Legal & General Global 100 Index | 44.75% | 109.65% | 0.09% |
Legal & General Global Technology Index | 49.92% | 198.31% | 0.20% |
Legal & General International Index Trust | 32.10% | 85.09% | 0.08% |
Legal & General US Index | 39.59% | 106.40% | 0.05% |
UBS S&P 500 Index | 41.41% | 103.53% | 0.09% |
Best-selling funds from interactive investor
Funds | 3 year performance | 5 year performance | Ongoing Charges Figure |
Royal London Short Term Money Market | 6.22% | 7.28% | 0.10% |
Legal & General Global Technology Index | 49.41% | 196.80% | 0.32% |
Vanguard LifeStrategy 80% Equity | 16.71% | 48.37% | 0.22% |
Fundsmith Equity | 18.63% | 76.65% | 0.94% |
Jupiter India | 86.41% | 77.81% | 0.99% |
HSBC FTSE All-World Index | 27.75% | 76.59% | 0.13% |
Vanguard LifeStrategy 100% Equity | 26.75% | 64.48% | 0.22% |
Vanguard US Equity Index | 35.50% | 98.22% | 0.10% |
Vanguard FTSE Dev World ex-UK Equity Index | 31.45% | 84.30% | 0.14% |
Vanguard FTSE Global All Cap | 25.51% | 71.63% | 0.23% |
Performance has been calculated in accordance with end-of-day market prices on 31/12/2023.
Best-selling investment trusts of December 2023
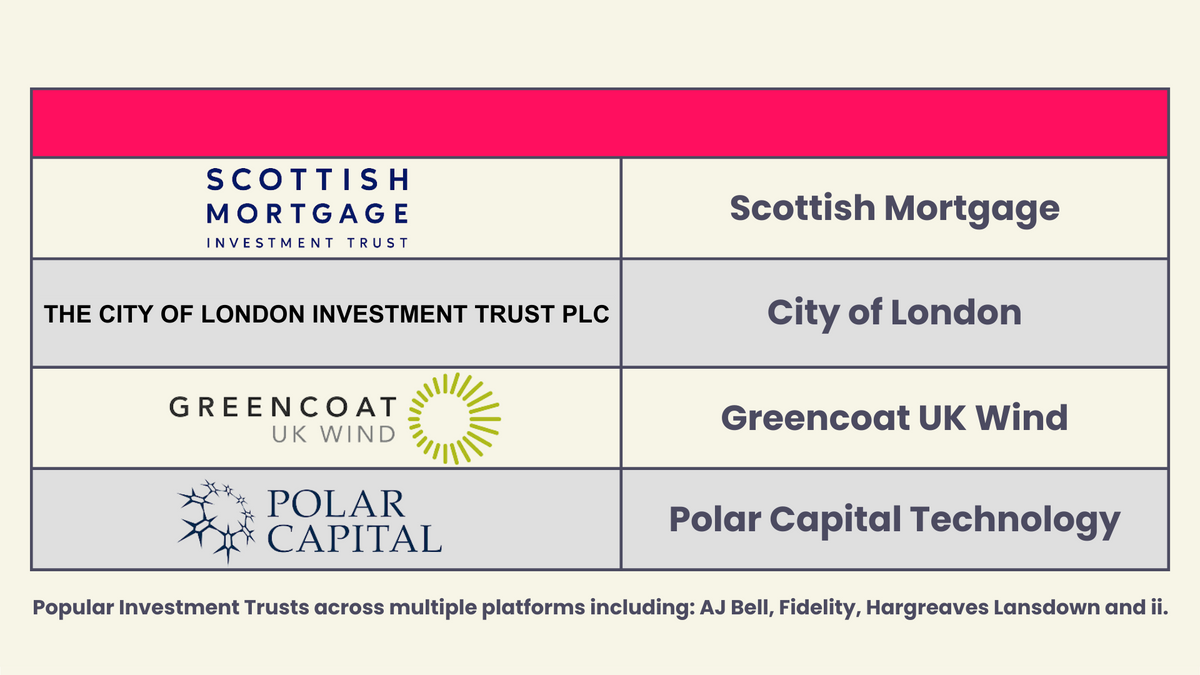
The four most popular investment trusts across AJ Bell, Fidelity, Hargreaves Lansdown and interactive investor were Scottish Mortgage, City of London, Greencoat UK Wind and Polar Capital Technology.

JP Morgan’s Global Growth & Income Investment Trust has roughly 55 holdings, with 68% of its assets currently allocated to the US. The Trust’s performance has been consistent across the past decade positively performing and comfortably beating its peer group index in 8 out of 10 years. 5 of the years have seen annual performance above 20%, including a 22.6% return in 2023. The annualised return over the past 5 years has been 15.2%, allowing an investor 5 years ago to have doubled their money if they bought and held.
Past performance is no guarantee of future returns, but it does help to explain the buzz around the Trust, which is currently trading at a premium of 1.41% above NAV. Trusts trading at a premium could be due to confidence in the investment strategy of managers and expectations about future profitability. The 3 portfolio managers have all been at JP Morgan for over 15 years and are CFA charterholders.
Best-selling investment trusts from AJ Bell
Investment Trusts | 3 year performance | 5 year performance | Ongoing Charges Figure |
Scottish Mortgage | -32.56% | 77.11% | 0.34% |
City of London | 26.44% | 34.48% | 0.37% |
BlackRock World Mining | 32.66% | 132.23% | 0.99% |
JP Morgan Global Growth & Income | 45.45% | 113.09% | 0.53% |
Bankers | -0.93% | 46.06% | 0.73% |
Witan | 11.08% | 39.27% | 1.32% |
Scottish American | 24.85% | 74.94% | 0.59% |
VinaCapital Vietnam Opportunity Fund | 15.45% | 55.03% | 1.64% |
Murray Income Trust | 17.44% | 47.09% | 0.50% |
Pacific Horizon | -25.78% | 93.39% | 0.72% |
Best-selling investment trusts from Fidelity
Investment Trusts | 3 year performance | 5 year performance | Ongoing Charges Figure |
Scottish Mortgage | -32.56% | 77.11% | 0.34% |
JP Morgan Global Growth & Income | 45.45% | 113.09% | 0.53% |
Fidelity Asian Values | 34.21% | 42.48% | 0.96% |
Polar Capital Technology | 12.58% | 135.05% | 0.81% |
Fidelity European | 35.03% | 99.36% | 0.78% |
Fidelity Special Values | 24.48% | 40.61% | 0.70% |
Murray International | 35.99% | 49.99% | 0.59% |
City of London | 26.44% | 34.48% | 0.37% |
Greencoat UK Wind | 32.45% | 55.82% | 1.03% |
Allianz Technology | 2.19% | 148.77% | 0.80% |
Best-selling investment trusts from Hargreaves Lansdown (in alphabetical order)
Investment Trusts | 3 year performance | 5 year performance | Ongoing Charges Figure |
Alliance Trust | 31.88% | 79.27% | 0.64% |
Ashoka India Equity | 77.37% | 166.30% | 0.50% |
Chrysalis Investments | -58.63% | -24.50% | 0.89% |
Greencoat UK Wind | 32.45% | 55.82% | 1.03% |
HICL Infrastructure | -6.88% | 13.28% | 1.06% |
India Capital Growth | 106.20% | 97.71% | 1.62% |
JP Morgan Global Growth & Income | 45.45% | 113.09% | 0.53% |
NextEnergy Solar Fund | 7.87% | 12.75% | 1.12% |
Pershing Square Holdings | 45.32% | 283.89% | 2.66% |
Polar Capital Technology | 12.58% | 135.05% | 0.81% |
Best-selling investment trusts from interactive investor
Investment Trusts | 3 year performance | 5 year performance | Ongoing Charges Figure |
Scottish Mortgage | -32.56% | 77.11% | 0.34% |
JP Morgan Global Growth & Income | 45.45% | 113.09% | 0.53% |
Greencoat UK Wind | 32.45% | 55.82% | 1.03% |
City of London | 26.44% | 34.48% | 0.37% |
BlackRock World Mining | 32.66% | 132.23% | 0.99% |
3i Group | 131.27% | 272.27% | 1.30% |
Pershing Square Holdings | 45.32% | 283.89% | 2.66% |
Polar Capital Technology | 12.58% | 135.05% | 0.81% |
India Capital Growth | 106.20% | 97.71% | 1.62% |
Alliance Trust | 31.88% | 79.27% | 0.64% |
Performance has been calculated in accordance with end-of-day market prices on 31/12/2023.
Best-selling ETFs of December 2023
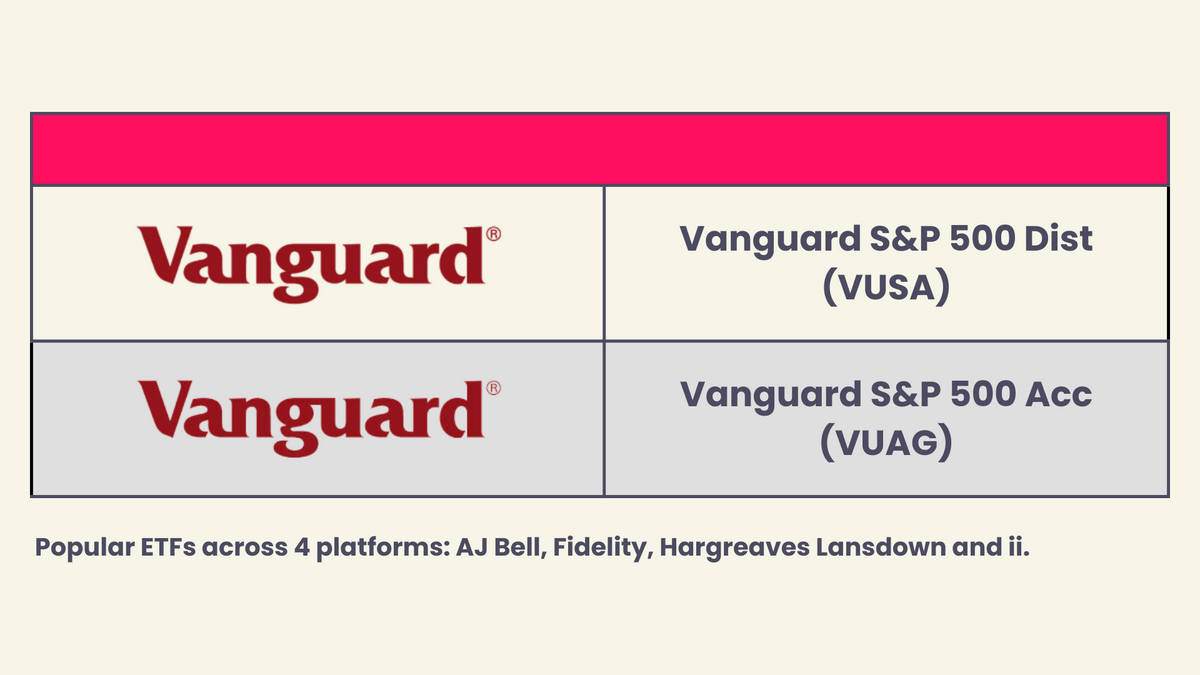
The two most popular ETFs across AJ Bell, Fidelity, Hargreaves Lansdown and interactive investor were Vanguard S&P 500 Dist (VUSA) and Vanguard S&P 500 Acc (VUAG).

Unsurprisingly, S&P 500 trackers continue to remain popular with UK investors. ETFs are a great, low-cost way to track market indexes, providing exposure to the investment returns of a wide range of companies in a specific sector with minimal hassle and fees.
Vanguard’s popular S&P 500 ETFs work on a full replication basis, which means that they seek to copy the S&P 500 benchmark completely, mirroring every single stock and transaction. Another approach to tracker ETFs is holding a sample of the same investments as the benchmark, which capture most of the return and risk attributes of the benchmark but don’t match it stride for stride. This is more common with emerging market ETF trackers, which have investments that are less liquid than developed markets.
S&P 500 returns across the past 5 years have been excellent, with Vanguard’s tracker returning 31% in 2019, 18% in 2020, 28% in 2021, -18% in 2022 and 26% last year in 2023. There has been much back and forth in recent years on whether US markets can continue to deliver such strong performance. Investors who decided to stick with US markets across this period will be glad they did so.
One thing to remember when looking at performance is that it is not a zero-sum game. If a portfolio returns -20% in one year and then 20% the next year, contrary to intuition, you are not even. For example, a 20% loss on a £100 portfolio would leave you with £80. A 20% gain the following year would bring you up to £96. It would take a 25% gain after a 20% drop to get back to where you started, and in a more extreme scenario, a 100% gain after a 50% drop. This is important to bear in mind, especially with more volatile investments.
Best-selling ETFs from AJ Bell
ETFs | 3 year performance | 5 year performance | Ongoing Charges Figure |
Vanguard S&P 500 UCITS ETF (VUSA) | 43.76% | 107.12% | 0.07% |
Vanguard S&P 500 UCITS ETF USD Acc (VUAG) | 41.51% | N/A | 0.07% |
iShares Global Clean Energy (INRG) | -38.93% | 96.36% | 0.65% |
iShares Core S&P 500 UCITS ETF USD (CSP1) | 41.51% | 103.87% | 0.07% |
iShares Core FTSE 100 (ISF) | 33.41% | 38.34% | 0.07% |
Vanguard FTSE All-World UCITS ETF (VWRL) | 27.90% | 74.93% | 0.22% |
iShares Physical Gold ETC (SGLN) | 16.49% | 59.46% | 0.12% |
iShares Core MSCI World (SWDA) | 32.71% | 83.17% | 0.20% |
Vanguard FTSE All-World UCITS ETF USD (VWRP) | 26.84% | N/A | 0.22% |
iShares S&P 500 Information Technology (IITU) | 61.40% | 221.24% | 0.15% |
Best-selling ETFs from Fidelity
ETFs | 3 year performance | 5 year performance | Ongoing Charges Figure |
Vanguard S&P 500 UCITS ETF (VUSA) | 43.76% | 107.12% | 0.07% |
Vanguard FTSE All-World UCITS ETF USD (VWRP) | 26.84% | N/A | 0.22% |
Vanguard S&P 500 UCITS ETF USD Acc (VUAG) | 41.51% | N/A | 0.07% |
iShares S&P 500 Information Technology (IITU) | 61.40% | 221.24% | 0.15% |
iShares Core UK Gilts UCITS ETF (IGLT) | -25.14% | -13.50% | 0.07% |
iShares NASDAQ 100 UCITS ETF USD (CNX1) | 41.56% | 171.19% | 0.33% |
Invesco NASDAQ 100 UCITS (EQQQ) | 44.56% | 177.23% | 0.30% |
iShares Core S&P 500 UCITS ETF USD (CSP1) | 41.51% | 103.87% | 0.07% |
Vanguard FTSE 100 (VUKE) | 33.40% | 38.17% | 0.09% |
Vanguard FTSE All-World UCITS ETF (VWRL) | 27.90% | 74.93% | 0.22% |
Best-selling ETFs from Hargreaves Lansdown (in alphabetical order)
ETFs | 3 year performance | 5 year performance | Ongoing Charges Figure |
HSBC MSCI World (HMWO) | 33.16% | 84.49% | 0.15% |
Invesco NASDAQ 100 UCITS (EQQQ) | 44.56% | 177.23% | 0.30% |
iShares Core MSCI World (SWDA) | 32.71% | 83.17% | 0.20% |
iShares Core S&P 500 UCITS ETF USD (CSP1) | 41.51% | 103.87% | 0.07% |
Legal & General Artificial Intelligence (AIAG) | N/A | N/A | 0.49% |
Vanguard FTSE All-World UCITS ETF USD (VWRP) | 26.84% | N/A | 0.22% |
Vanguard FTSE Developed World (VHVG) | 31.66% | N/A | 0.12% |
Vanguard S&P 500 UCITS ETF USD Acc (VUAG) | 41.51% | N/A | 0.07% |
Vanguard S&P 500 UCITS ETF GBP (VUSA) | 43.76% | 107.12% | 0.07% |
WisdomTree DAX 3x Daily Short (3SDE) | -69.42% | -94.15% | 2.40% |
Best-selling ETFs from interactive investor
ETFs | 3 year performance | 5 year performance | Ongoing Charges Figure |
Vanguard S&P 500 UCITS ETF (VUSA) | 43.76% | 107.12% | 0.07% |
Vanguard S&P 500 (VUAG) | 41.51% | N/A | 0.07% |
iShares Core MSCI World (SWDA) | 32.71% | 83.17% | 0.20% |
Vanguard FTSE All-World UCITS ETF (VWRL) | 27.90% | 74.93% | 0.22% |
iShares Core FTSE 100 (ISF) | 33.41% | 38.34% | 0.07% |
Invesco NASDAQ 100 UCITS (EQQQ) | 44.56% | 177.23% | 0.30% |
iShares Physical Gold ETC (SGLN) | 16.49% | 59.46% | 0.12% |
iShares Core S&P 500 USD (CSPX) | 41.51% | 103.87% | 0.07% |
WisdomTree FTSE 100 3x Daily Leveraged (3UKL) | 67.41% | 26.42% | 2.15% |
Vanguard FTSE Developed World (VHVG) | 31.66% | N/A | 0.12% |
Performance has been calculated in accordance with end-of-day market prices on 31/12/2023.