Green shoots and shifting sentiment – why UK equities deserve a closer look
A world in flux – and a chance for Schroders' UK equity investment trusts to shine
Sponsored by Schroders
24 Sep, 2025
This section is a paid promotion created in partnership with Schroders. The views and information presented reflect the sponsor’s messaging and may not represent the independent opinions of Boring Money. While we aim to ensure accuracy and relevance, this content should not be considered impartial advice.
By Sue Noffke, Head of UK Equities and Jean Roche, Fund Manager, Pan-European Small and Mid Cap


It’s no secret that UK equities have fallen out of favour in recent years. For many global investors, it’s been all too easy to overlook the market – a combination of shrinking index weightings, a revolving door of political leadership, a perceived lack of structural growth stories and a string of other excuses to look elsewhere. That is, until recently...
Data analysing capital flows in 2025 suggests that something profound has changed. US investors, in particular, have been buying UK stocks above all other international markets this year, taking advantage of others’ unwillingness to do so. This reflects growing recognition that UK equities – long under-owned and often misunderstood – may now offer one of the most compelling combinations of resilience, recovery potential and attractive valuation anywhere in the developed world.
A changing world order 🌍
The long-standing dominance of US equities – particularly the extraordinary run of US technology stocks – has shaped global capital allocation for more than a decade. But as investors increasingly question whether America’s evolving stance on the world stage signals the end of US exceptionalism, there are signs that this long period of US outperformance may be reaching a turning point.
Growing political uncertainty, rising protectionism and the more transactional nature of US foreign policy are prompting investors to reassess risk and reward across global markets. At the same time, concerns are mounting over the sustainability of America’s deteriorating fiscal position. With US equity valuations still elevated – and market leadership concentrated in a small group of dominant technology stocks – the case for diversifying away from the US has become stronger.
This global reappraisal creates opportunity. Investors are beginning to look further afield for markets with very different characteristics – not just in terms of sector composition, but in terms of starting valuations and long-term return potential. The UK fits that brief well – its sectoral profile is naturally more defensive than most, providing a degree of built-in resilience to global shocks. Indeed, there are signs that the UK stock market is already starting to benefit from a broader rotation away from the US.

The UK’s green shoots 🌱
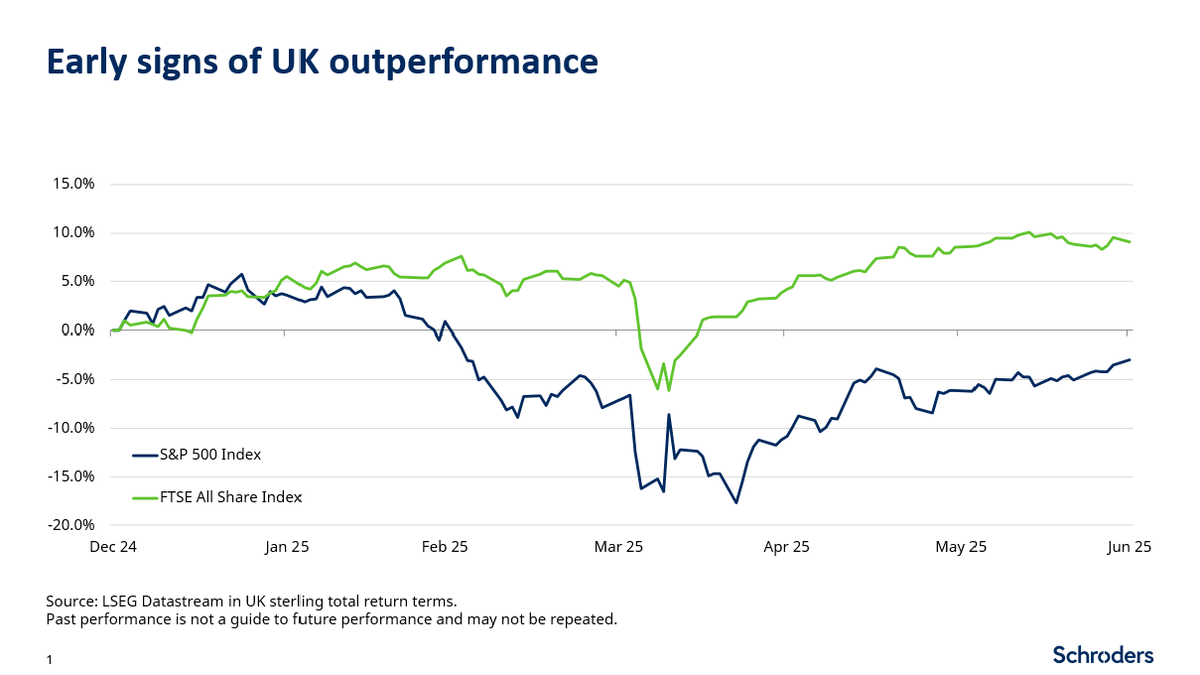
The UK is by no means the only regional equity market to be benefiting from this trend, but as the chart above illustrates, we are now seeing tentative signs of improved returns from UK equities, particularly when compared to the US. This is arguably long overdue and starts from a low base, but it also reflects the deeper concerns about America’s evolving role in the world and, with it, the value of the dollar. While the UK market has outperformed in local currency terms, when translated back to sterling, the weakness of the dollar erodes US equity returns even further.
Fund flow data from the Investment Association also shows an improvement in sentiment. UK equity funds remain in outflow – a persistent trend in recent years – but the pace has slowed, with May 2025 being the best month for net flows in nearly four years. If this moderation continues, it could suggest that the UK stock market’s improved performance has further to run, particularly if net domestic outflows continue to be more than offset by inflows from global investors.
It isn’t just that the US has become a less attractive destination for some investors, however. Several domestic developments may also have contributed to this renewed interest in UK equities. For example, in an environment of global trade friction following President Trump’s ‘Liberation Day’ announcements, the UK has agreed trade deals with the EU, India and the US. This lends a degree of predictability to the UK’s international trade dynamics – something that remains elusive for many other major economies.
Meanwhile, momentum is building at the domestic policy level. A series of initiatives – including Chancellor Rachel Reeves’ so-called ‘Leeds Reforms’ – are aiming to encourage a long-term investment culture, revive the UK’s capital markets and rewire the system in favour of growth. These proposals include changes to ISA rules, a review of the regulatory framework and fresh thinking on how to make capital work harder across the economy. Separately, Schroders was among the signatories to a new Pensions Pledge, committing some of the UK’s largest employers to focus on long-term returns and broaden the use of private assets in pension schemes. It’s early days, but the direction of travel is encouraging.
Valuation support 💷
Another reason for the renewed interest in UK equities may stem from the starting valuations on offer. For a variety of reasons, from Brexit to the short-lived Truss premiership, the UK stock market has been out of favour for some time, and now stands at a marked valuation discount to other regional markets. Indeed, according to data from J.P. Morgan, UK stocks started the year at a discount of almost 50% to US equities, based on forward price / earnings (P/E) ratios. Less than ten years ago, the valuation of these two markets was broadly the same – now, the UK is effectively in “buy one, get one free” territory when compared to the US.
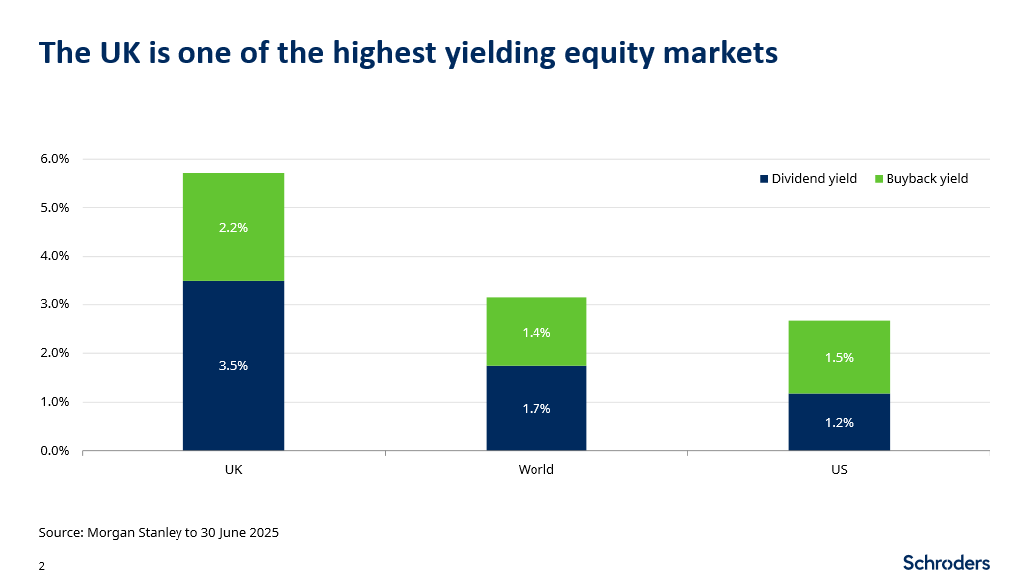
From the perspective of yield too, the UK is among the most rewarding of global equity markets. The current dividend yield on the UK stock market is 3.5%, which is more than double that of the world as a whole. Furthermore, when you consider buyback yield (the additional return delivered by companies using cash flow to buy back their own shares), the overall yield from the UK stock market is closer to 6%.

With starting valuations being the key determinant of future long-term returns, there is much to look forward to for UK equity investors. Indeed, despite remaining under-owned and out of favour, UK equities have quietly delivered solid returns over the last five years – compounding at 10.8% per annum in sterling terms. That’s behind the S&P 500, though ahead when excluding the Mag 7, at 9.56%, and ahead too, of many global peers (Euro Stoxx 50 at 9.24% p.a. and MSCI Europe ex UK at 7.27% p.a.) as well as comfortably above inflation.[1]
Two ways to play 🕹️
The combination of deep undervaluation, prolonged under-ownership and improving fundamentals could mark the start of something more meaningful and enduring for UK equities. To paraphrase Winston Churchill, this may not be the end of a renewed period of outperformance from UK equities. It may not even be the beginning of the end. But it could, just possibly, be the end of the beginning.
For investors looking to position for this potential renaissance, Schroders offers two distinct – but complementary – investment trusts that focus on the opportunity in UK equities.
1️⃣ Schroder Income Growth Fund – compounding the benefits of astute stock picking

2️⃣ Schroder UK Mid Cap Fund – growth and recovery potential
Conclusion – positively shifting sentiment 🌤️
There is growing evidence that the UK is becoming a more popular destination among global asset allocators. As investors increasingly look to diversify away from the US, the UK’s combination of low starting valuations, improving fundamentals and early signs of improved performance make it a compelling alternative.
Clearly, challenges remain – not least the UK’s stretched fiscal position, which means future policy choices will need to be carefully weighed. But the UK is home to a wide range of businesses – both large and small – that have proven remarkably adept at thriving as conditions evolve. To name but one, the food manufacturing group Cranswick, held by both SCF and SCP, has delivered outstanding growth over the past three decades, providing shareholders with a return of more than 200 times their original investment.
Meanwhile, it may still be too early to call time on US exceptionalism, but if that moment is approaching, there are deeper questions to consider. The dollar’s role as the world’s reserve currency, the implications for global capital flows and the future direction of foreign exchange markets more broadly, all come into play. In this context, bringing capital back home could become a more intuitive step for domestic investors, especially if globalisation continues to retreat.
This all adds weight to the idea that the way investors think about the UK as an investment opportunity is beginning to change. And with two distinct strategies available via Schroders’ investment trusts, domestic investors have options – whether they favour steady income, structural growth or a combination of both.
________________________________________________________________
[1] - LSEG Workplace in UK sterling total return terms to 30 June 2025. Past performance is not a guide to future performance and may not be repeated
[2] - Schroders, based on full year dividends of 2.0p in 2004 and 21.5p in 2024
Fund risk considerations: Schroder Income Growth Fund plc and Schroder UK Mid Cap Fund plc
Concentration risk: The fund may be concentrated in a limited number of geographical regions, industry sectors, markets and/or individual positions. This may result in large changes in the value of the fund, both up or down.
Counterparty risk: The fund may have contractual agreements with counterparties. If a counterparty is unable to fulfil their obligations, the sum that they owe to the fund may be lost in part or in whole.
Currency risk: If the fund’s investments are denominated in currencies different to the fund’s base currency, the fund may lose value as a result of movements in foreign exchange rates, otherwise known as currency rates. If the investor holds a share class in a different currency to the base currency of the fund, investors may be exposed to losses as a result of movements in currency rates.
Liquidity risk: The fund invests in illiquid instruments, which are harder to sell. Illiquidity increases the risks that the fund will be unable to sell its holdings in a timely manner in order to meet its financial obligations at a given point in time. It may also mean that there could be delays in investing committed capital into the asset class.
Market risk: The value of investments can go up and down and an investor may not get back the amount initially invested.
Performance risk: Investment objectives express an intended result but there is no guarantee that such a result will be achieved. Depending on market conditions and the macro economic environment, investment objectives may become more difficult to achieve.
Smaller companies risk: Smaller companies generally carry greater liquidity risk than larger companies, meaning they are harder to buy and sell, and they may also fluctuate in value to a greater extent. As a result of fees being charged to capital, the distributable income of the fund may be higher, but there is the potential that performance or capital value may be eroded. The price of shares in the Company is determined by market supply and demand, and this may be different to the net asset value of the Company. This means the price may be volatile, meaning the price may go up and down to a greater extent in response to changes in demand
Discrete yearly performance (%) | Aug 15 - Aug 16 | Aug 16 - Aug 17 | Aug 17 - Aug 18 | Aug 18 - Aug 19 | Aug 19 - Aug 20 | Aug 20 - Aug 21 | Aug 21 - Aug 22 | Aug 22 - Aug 23 | Aug 23 - Aug 24 | Aug 24 - Aug 25 |
Share Price | -8.2 | 20.6 | 8.0 | -4.4 | -4.8 | 76.5 | -31.3 | 4.2 | 23.3 | 11.3 |
Net Asset Value | 1.7 | 19.8 | 8.9 | -4.2 | -7.2 | 52.3 | -23.4 | 3.3 | 19.9 | 4.7 |
Reference Index | 5.1 | 14.2 | 7.1 | -5.0 | -9.3 | 42.9 | -21.7 | 3.1 | 19.6 | 4.6 |
Discrete yearly performance (%) | Aug 15 - Aug 16 | Aug 16 - Aug 17 | Aug 17 - Aug 18 | Aug 18 - Aug 19 | Aug 19 - Aug 20 | Aug 20 - Aug 21 | Aug 21 - Aug 22 | Aug 22 - Aug 23 | Aug 23 - Aug 24 | Aug 24 - Aug 25 |
Share Price | -0.8 | 18.8 | 7.0 | -5.4 | -7.0 | 37.0 | -4.7 | 3.0 | 17.7 | 12.9 |
Net Asset Value | 8.4 | 14.3 | 4.0 | -1.9 | -13.2 | 34.3 | -2.7 | 4.2 | 19.0 | 9.6 |
Reference Index | 11.7 | 14.3 | 4.7 | 0.4 | -12.6 | 26.9 | 1.0 | 5.2 | 17.0 | 12.6 |
Past performance is not a guide to future performance. Source: Morningstar, net income reinvested, net of ongoing charges and portfolio costs and where applicable, performance fees, in GBP.
____________________________________________________________________
Important information
This communication is marketing material. The views and opinions contained herein are those of the named author(s) on this page, and may not necessarily represent views expressed or reflected in other Schroders communications, strategies or funds.
This document is intended to be for information purposes only and it is not intended as promotional material in any respect. The material is not intended as an offer or solicitation for the purchase or sale of any financial instrument. The material is not intended to provide, and should not be relied on for, accounting, legal or tax advice, or investment recommendations. Information herein is believed to be reliable but Schroder Investment Management Ltd (Schroders) does not warrant its completeness or accuracy.
The data has been sourced by Schroders and should be independently verified before further publication or use. No responsibility can be accepted for error of fact or opinion. This does not exclude or restrict any duty or liability that Schroders has to its customers under the Financial Services and Markets Act 2000 (as amended from time to time) or any other regulatory system. Reliance should not be placed on the views and information in the document when taking individual investment and/or strategic decisions.
Past Performance is not a guide to future performance. The value of investments and the income from them may go down as well as up and investors may not get back the amounts originally invested. Exchange rate changes may cause the value of any overseas investments to rise or fall.
Any sectors, securities, regions or countries shown above are for illustrative purposes only and are not to be considered a recommendation to buy or sell.
The forecasts included should not be relied upon, are not guaranteed and are provided only as at the date of issue. Our forecasts are based on our own assumptions which may change. Forecasts and assumptions may be affected by external economic or other factors.
Issued by Schroder Unit Trusts Limited, 1 London Wall Place, London EC2Y 5AU. Registered Number 4191730 England. Authorised and regulated by the Financial Conduct Authority.