




Best-selling funds, Investment Trusts and ETFs of December 2025
Discover the most popular investments on the UK's top platforms
By Boring Money
14 Jan, 2026
Every month, Boring Money conducts rigorous research on what the best-selling investments were across the UK's major investment platforms - including AJ Bell, Fidelity, Hargreaves Lansdown and interactive investor.
Boring Money's expert analysis
Global stock markets ended 2025 on broadly positive note, albeit with plenty of lingering worries over the durability of the artificial intelligence trade. It has been a year characterised by diversification away from the US, and the S&P 500 lagged many of its peers again in December. In contrast, Europe, the UK, and particularly emerging markets, saw strong gains over the month.
The S&P 500 ended the month at 6,846[1], up 0.1% month on month, finishing the year up 17.9% in dollar terms. This was a creditable performance, but returns were far weaker for UK and European investors because of the weakness of the dollar. Equally, these gains were accompanied by a growing drumbeat of concern over technology valuations, optimistic deal-making, and capital spending. It is notable that the share price of Nvidia, the poster child for AI, is at the same level it was in October.
Markets also seemed largely impervious to the strength of US GDP. As data emerged after the government shutdown, it showed the US economy growing strongly, at 4.3% for the third quarter[2]. However, inflation and interest rates remain the swing factors for US markets. The picture on inflation remains mixed, and there are still concerns that the impact of tariffs has not yet been realised in the data. These will be key areas to watch in the months ahead.
Emerging markets had a strong month, with the MSCI Emerging Markets index up 3% in December alone. They transcended weakness in the Chinese market[3], where uncertain economic data kept investors cautious. A revival in the Indian market has helped, but the real strength came from Taiwan and Korea, which were buoyed by gains in the semiconductor sector. Many of the smaller markets in Eastern Europe, Latin America, and the Middle East also performed well.
UK stock markets recovered in the wake of the budget. The FTSE 100 capped a strong year with a 2.4% gain over the month. It has delivered a total return of 25.8% for 2025 in sterling terms[4], putting it ahead of the majority of its global peers. However, the UK’s small and mid-cap sectors have remained weak over concerns about the domestic economy. Here, there was little to cheer. While inflation eased and there was a welcome cut in interest rates, growth contracted slightly, wage growth fell, and unemployment rose. The economy looks stagnant at best.
European markets were led by the financial sector. They have enjoyed a strong year, with the MSCI Europe ex UK index up 20.4% in 2025. The European economy continues to tick higher, even if growth is unexciting. The ECB kept rates on hold, while upgrading its growth forecasts for 2025 to 2028. Inflation remains benign, at or near the European Central Bank target.
Fixed-income markets had an uneventful month. The US 10-year treasury yield ended the month at 4.2%, having started the month at 4.1%. With the worries over the budget behind it, the UK gilt yield was unchanged, starting and ending the month at just under 4.5%. Having pushed a little higher at the end of November, by the end of December, corporate bond spreads had returned to at, or near, multi-decade lows.
Best-selling funds | December 2025
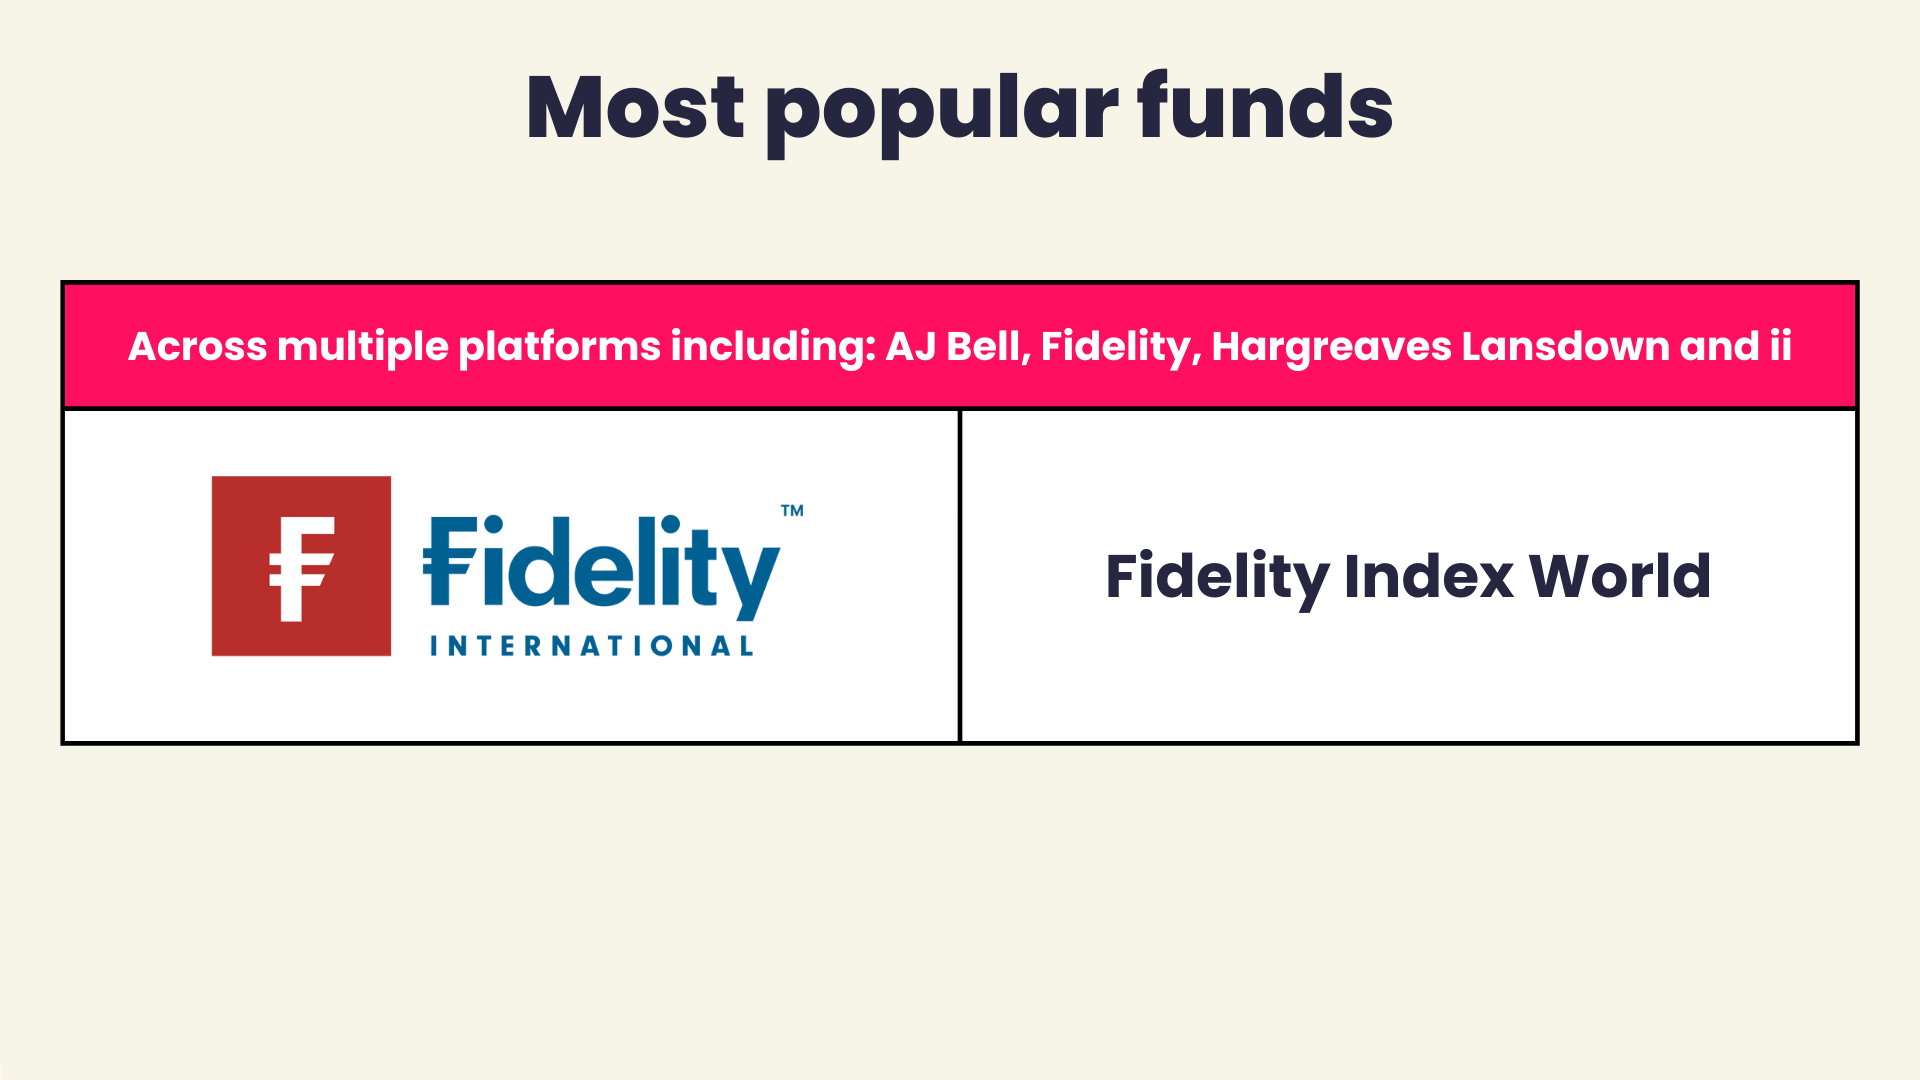
The most popular fund across multiple platforms, including AJ Bell, Fidelity, Hargreaves Lansdown and interactive investor was Fidelity Index World.
The caution seen in November was less in evidence over December. Last month, over half the most popular funds on the Fidelity platform were cash-based, but that had dwindled to just three for December. The Royal London Short Term Money Market fund was a best-seller on the ii platform, but cash funds didn’t appear in the top 10 most popular options for the other two platforms.
The latest Investment Association fund statistics showed reviving popularity for active funds over passive funds. However, passive funds remained in vogue across all four platforms. At least half of all funds sold in AJ Bell and Fidelity were passive funds. For Hargreaves Lansdown and ii, that rose to nine out of 10. Platform investors have yet to be convinced that there is a reason to look beyond the larger companies that make up a significant share of global indices.
Nevertheless, there was greater diversity of regional exposure. The Artemis SmartGARP European Equity fund made an appearance on the ii and Fidelity platforms. European funds have been notably absent from the best-seller lists, in spite of strong performance in 2025. The Artemis fund is top of the Europe ex UK sector over three years, having beaten its nearest rival by 42.3%[5]
Although Global, US, and technology funds dominated the best-seller lists over the month, the UK continued to garner some interest. The Fidelity Special Situations fund and L&G UK index trust both appeared on the Fidelity platform, suggesting investors may be warming up to the UK after a strong year for the FTSE 100.
Best-selling funds from AJ Bell
Fund | 3 year performance | 5 year performance | OCF |
AJ Bell Adventurous I Acc | 42.2% | 62.3% | 0.31% |
AJ Bell Moderately Adv I Acc | 35.3% | 47.7% | 0.31% |
Fidelity Index World | Acc | 59.9% | 82.2% | 0.12% |
AJ Bell Balanced I Acc | 28.7% | 37.2% | 0.31% |
AJ Bell Global Growth I Acc | 38.7% | 58.6% | 0.31% |
HSBC FTSE All-World Index C Acc | 57.8% | 74.7% | 0.13% |
Vanguard FTSE Global All Cp Idx £ Acc | 54.1% | 68.6% | 0.23% |
Vanguard LifeStrategy 100% Equity A Acc | 53.8% | 71.8% | 0.22% |
AJ Bell Responsible Scrn Gr I GBP Acc | 38.8% | 41.2% | 0.45% |
Vanguard LifeStrategy 80% Equity A Acc | 44.1% | 50.4% | 0.22% |
Performance figures are retrieved from FE FundInfo on a Total Return is a comprehensive way of measuring investment performance that includes two components: capital appreciation/depreciation (changes in the actual price or value of the investment) and income distributions (any dividends, interest payments, or other distributions paid out during the measurement period)..
Best-selling funds from Fidelity
Fund | 3 year performance | 5 year performance | OCF |
Fidelity Cash Fund | Acc | 14.9% | 16.3% | 0.15% |
Royal London Short Term Money Market Fund Acc | 15.2% | 16.8% | 0.10% |
Fidelity Index World Fund | 59.9% | 82.2% | 0.12% |
Fidelity Cash Fund | Inc | 14.9% | 16.3% | 0.15% |
Legal & General UK Index Trust I Inc | 45.6% | 72.4% | 0.10% |
Fidelity Special Situations | 55.3% | 91.3% | 0.91% |
Artemis Global Income Fund Class | 101.8% | 148.8% | 0.87% |
Legal & General Global Technology Index Trust | 152.9% | 146.6% | 0.31% |
Ninety One Global Gold Fund | 202.7% | 170.1% | 0.86% |
Artemis SmartGARP European Eqty Cl I Acc | 108.8% | 154.5% | 0.86% |
Performance figures are retrieved from FE FundInfo on a Total Return is a comprehensive way of measuring investment performance that includes two components: capital appreciation/depreciation (changes in the actual price or value of the investment) and income distributions (any dividends, interest payments, or other distributions paid out during the measurement period)..
Best-selling funds from Hargreaves Lansdown
Fund | 3 year performance | 5 year performance | OCF |
Artemis Global Income Fund | 101.8% | 148.8% | 0.87% |
Fidelity Index World | 59.9% | 82.2% | 0.12% |
UBS S&P 500 Index | 65.0% | 96.5% | 0.09% |
Vanguard FTSE Global All Cap Index | 54.1% | 68.6% | 0.23% |
Legal & General International Index Trust | 61.1% | 81.5% | 0.08% |
Legal & General Global Technology Index | 152.9% | 146.6% | 0.31% |
Legal & General US Index | 67.2% | 94.4% | 0.10% |
HSBC FTSE All World Index | 57.8% | 74.7% | 0.13% |
Vanguard LifeStrategy 100% Equity | 53.8% | 71.8% | 0.22% |
Legal & General European Index | 49.6% | 62.0% | 0.06% |
Performance figures are retrieved from FE FundInfo on a Total Return is a comprehensive way of measuring investment performance that includes two components: capital appreciation/depreciation (changes in the actual price or value of the investment) and income distributions (any dividends, interest payments, or other distributions paid out during the measurement period)..
Best-selling funds from interactive investor
Fund | 3 year performance | 5 year performance | OCF |
Royal London Short Term Money Market (Acc) | 15.2% | 16.8% | 0.10% |
Vanguard LifeStrategy 80% Equity | 44.1% | 50.4% | 0.22% |
Artemis Global Income I Acc | 101.8% | 148.8% | 0.87% |
Vanguard FTSE Global All Cp Idx £ Acc | 54.1% | 68.6% | 0.23% |
HSBC FTSE All-World Index C Acc | 57.8% | 74.7% | 0.13% |
Vanguard LifeStrategy 100% Equity A Acc | 53.8% | 71.8% | 0.22% |
L&G Global Technology Index Trust | 152.9% | 146.6% | 0.31% |
Vanguard LifeStrategy 60% Equity A Acc | 34.8% | 31.6% | 0.22% |
Fidelity Index World | 59.9% | 82.2% | 0.12% |
Artemis SmartGARP European Equity | 108.8% | 154.5% | 0.86% |
Performance figures are retrieved from FE FundInfo on a Total Return is a comprehensive way of measuring investment performance that includes two components: capital appreciation/depreciation (changes in the actual price or value of the investment) and income distributions (any dividends, interest payments, or other distributions paid out during the measurement period)..
Data provided by FE FundInfo, correct as at 31 December 2025.
Best-selling Investment Trusts | December 2025
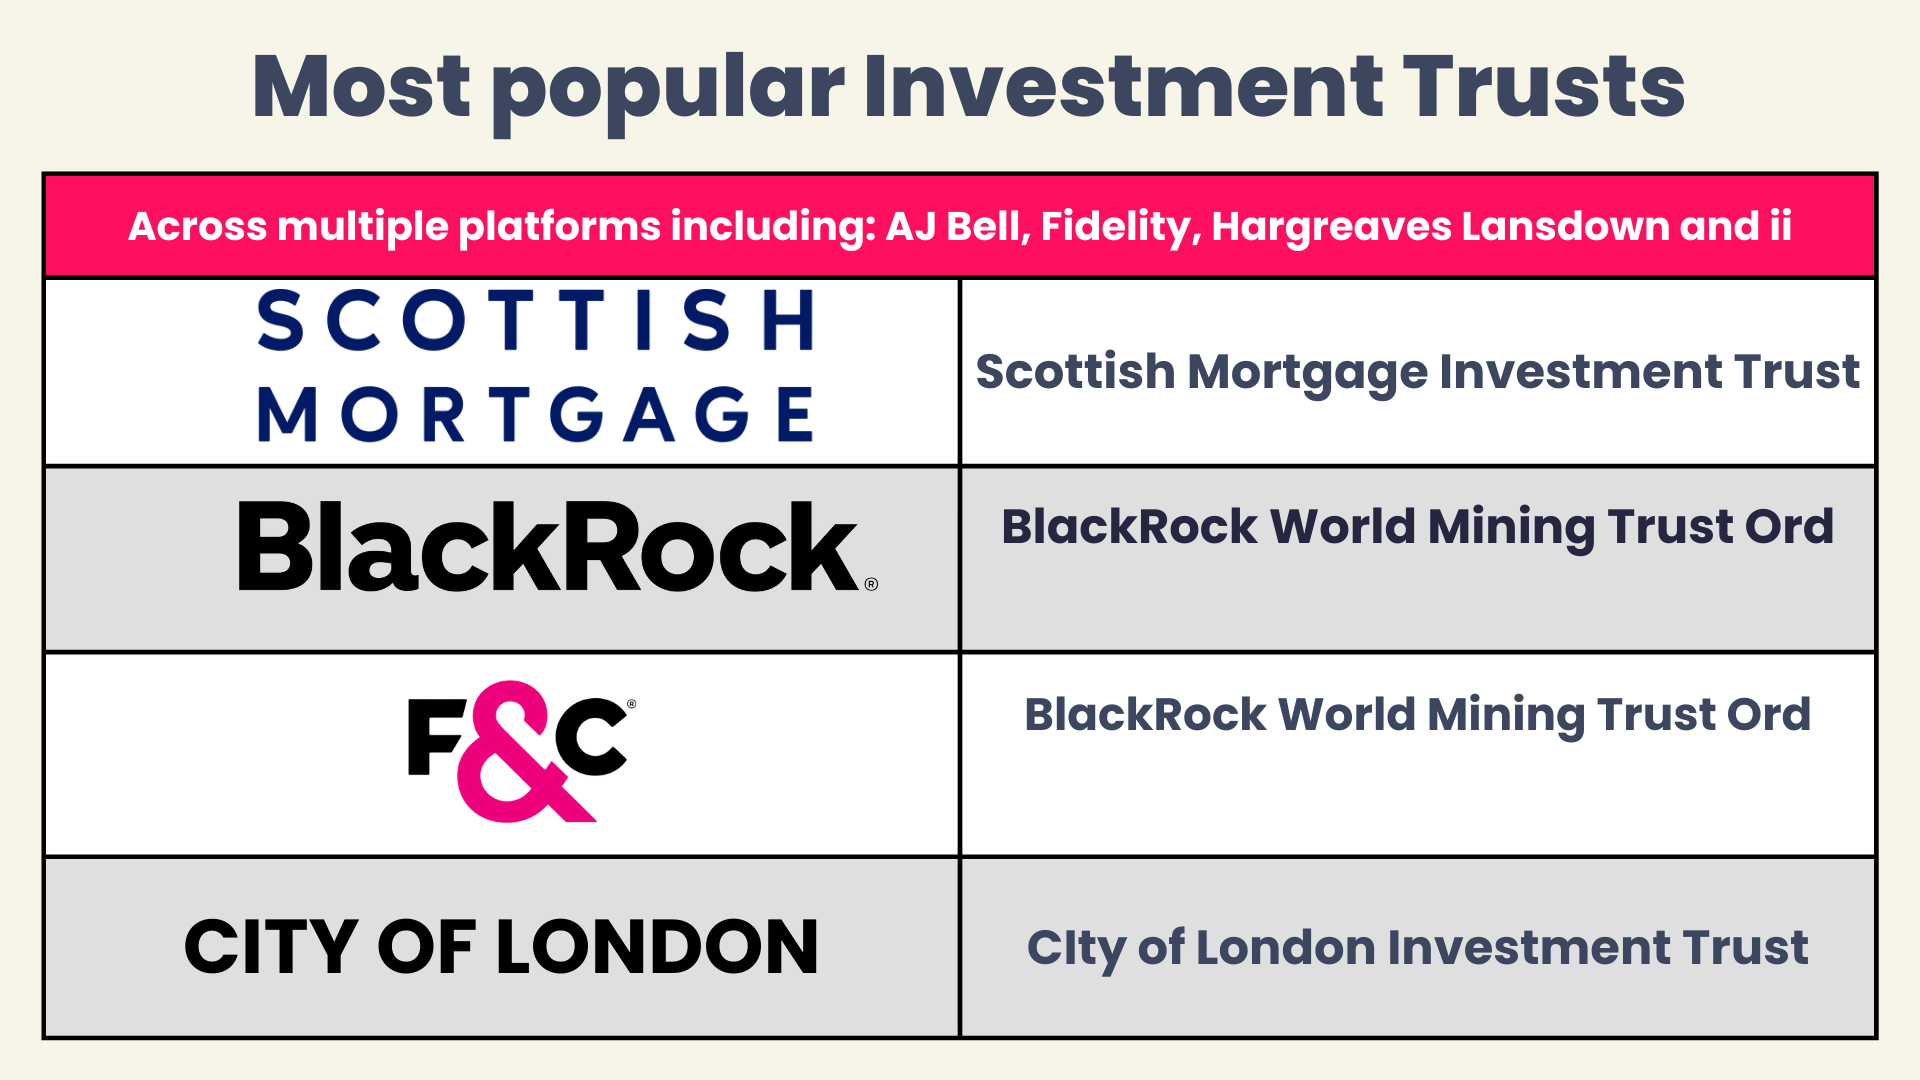
The most popular Investment Trusts across AJ Bell, Fidelity, Hargreaves Lansdown, and interactive investor were Scottish Mortgage, BlackRock World Mining Trust Ord, City of London and F&C.
Investment Trust investors showed no signs of worrying about the AI trade: Scottish Mortgage was the top seller on every platform. While manager Tom Slater has trimmed some of the Trust’s AI holdings after strong price performance, the team still believes that AI will be transformational for the global economy and holds TSMC, Nvidia, ASML, and Meta among its top 10 positions. There was also plenty of enthusiasm for dedicated technology trusts. Polar Capital Technology appeared in the top 10 on all four platforms.
Elsewhere, investors were sticking with Greencoat UK Wind, a top seller on AJ Bell, Hargreaves Lansdown, and ii. The three-year performance figures are still grim, with a fall of 18.8%, but there have been tentative signs of a turnaround in the very short term.
Seraphim Space Investment Trust was a surprise winner on both the Hargreaves Lansdown and ii platforms. The Trust, which invests in satellite technology, is up 165.5% over three years. One of its holdings, ICEYE, received a significant boost in December, signing a €1.7bn contract with defence giant Rheinmetall to provide space-based reconnaissance data. This sent the share price soaring and attracted investor interest.
Elsewhere, it was the familiar favourites that took the top spots, such as City of London, F&C, and JPMorgan Global Growth & Income. A couple of the Asia Trusts – Fidelity Asian Values and Fidelity China Special Situations – also drew attention, as did BlackRock World Mining, as commodity prices rose.
Best-selling Investment Trusts from AJ Bell
Investment Trust | 3 year performance | 5 year performance | OCF |
Scottish Mortgage Ord | 66.5% | -0.1% | 0.31% |
BlackRock World Mining Trust Ord | 34.8% | 99.5% | 1.84% |
City of London | 46.6% | 79.2% | 0.36% |
JPMorgan Global Growth & Income | 51.2% | 79.4% | 0.39% |
F&C Investment Trust | 44.9% | 71.5% | 0.45% |
Polar Capital Technology | 169.1% | 101.3% | 0.77% |
Greencoat UK Wind | -18.8% | 2.0% | 0.95% |
Scottish American | 9.9% | 26.8% | 0.58% |
Brunner | 48.4% | 83.5% | 0.61% |
3i Group | 160.4% | 224.7% | 0.67% |
Performance figures are retrieved from FE FundInfo on a Total Return is a comprehensive way of measuring investment performance that includes two components: capital appreciation/depreciation (changes in the actual price or value of the investment) and income distributions (any dividends, interest payments, or other distributions paid out during the measurement period)..
*Data provided by Morningstar, correct as at 31 December 2025.
Best-selling Investment Trusts from Fidelity
Investment Trust | 3 year performance | 5 year performance | OCF |
Scottish Mortgage | 66.5% | -0.1% | 0.31% |
Fidelity Special Values | 64.2% | 97.6% | 0.68% |
Fidelity Asian Values | 32.1% | 65.6% | 0.95% |
City of London | 46.6% | 79.2% | 0.36% |
Fidelity China Special Situations | 38.1% | -10.2% | 0.89% |
Blackrock World Mining Trust | 34.8% | 99.5% | 1.84% |
Temple Bar Investment Trust | 92.8% | 139.7% | 0.61% |
International Public Partnership | 0.4% | -2.0% | 1.12% |
Polar Capital Technology Trust | 169.1% | 101.3% | 0.77% |
F&C | 44.9% | 71.5% | 0.45% |
Performance figures are retrieved from FE FundInfo on a Total Return is a comprehensive way of measuring investment performance that includes two components: capital appreciation/depreciation (changes in the actual price or value of the investment) and income distributions (any dividends, interest payments, or other distributions paid out during the measurement period)..
Best-selling Investment Trusts from Hargreaves Lansdown
Investment Trust | 3 year performance | 5 year performance | OCF |
Scottish Mortgage | 66.5% | -0.1% | 0.31% |
City of London | 46.6% | 79.2% | 0.36% |
3i Group | 160.4% | 224.7% | 0.67% |
Greencoat UK Wind | -18.8% | 2.0% | 0.95% |
BlackRock World Mining Trust | 34.8% | 99.5% | 1.84% |
Polar Capital Technology Trust | 44.8% | 58.9% | 0.56% |
F&C Investment Trust | 44.9% | 71.5% | 0.45% |
Temple Bar | 92.8% | 139.7% | 0.61% |
Seraphim Space Investment Trust | 165.5% | N/A | 1.77% |
JPMorgan Global Growth & Income | 51.2% | 79.4% | 0.39% |
Performance figures are retrieved from FE FundInfo on a Total Return is a comprehensive way of measuring investment performance that includes two components: capital appreciation/depreciation (changes in the actual price or value of the investment) and income distributions (any dividends, interest payments, or other distributions paid out during the measurement period)..
Best-selling Investment Trusts from interactive investor
Investment Trust | 3 year performance | 5 year performance | OCF |
Scottish Mortgage | 66.5% | -0.1% | 0.31% |
Greencoat UK Wind | -18.8% | 2.0% | 0.95% |
City of London | 46.6% | 79.2% | 0.36% |
3i Group | 160.4% | 224.7% | 0.67% |
Temple Bar | 92.8% | 139.7% | 0.61% |
Seraphim Space Investment Trust | 165.5% | N/A | 1.77% |
BlackRock World Mining Trust Ord | 34.8% | 99.5% | 1.84% |
Polar Capital Technology Ord | 169.1% | 101.3% | 0.77% |
NextEnergy Solar | -37.3% | -25.0% | 1.18% |
F&C Investment Trust | 44.9% | 71.5% | 0.45% |
Performance figures are retrieved from FE FundInfo on a Total Return is a comprehensive way of measuring investment performance that includes two components: capital appreciation/depreciation (changes in the actual price or value of the investment) and income distributions (any dividends, interest payments, or other distributions paid out during the measurement period)..
Data provided by FE FundInfo, correct as at 31 December 2025.
Best-selling ETFs | December 2025
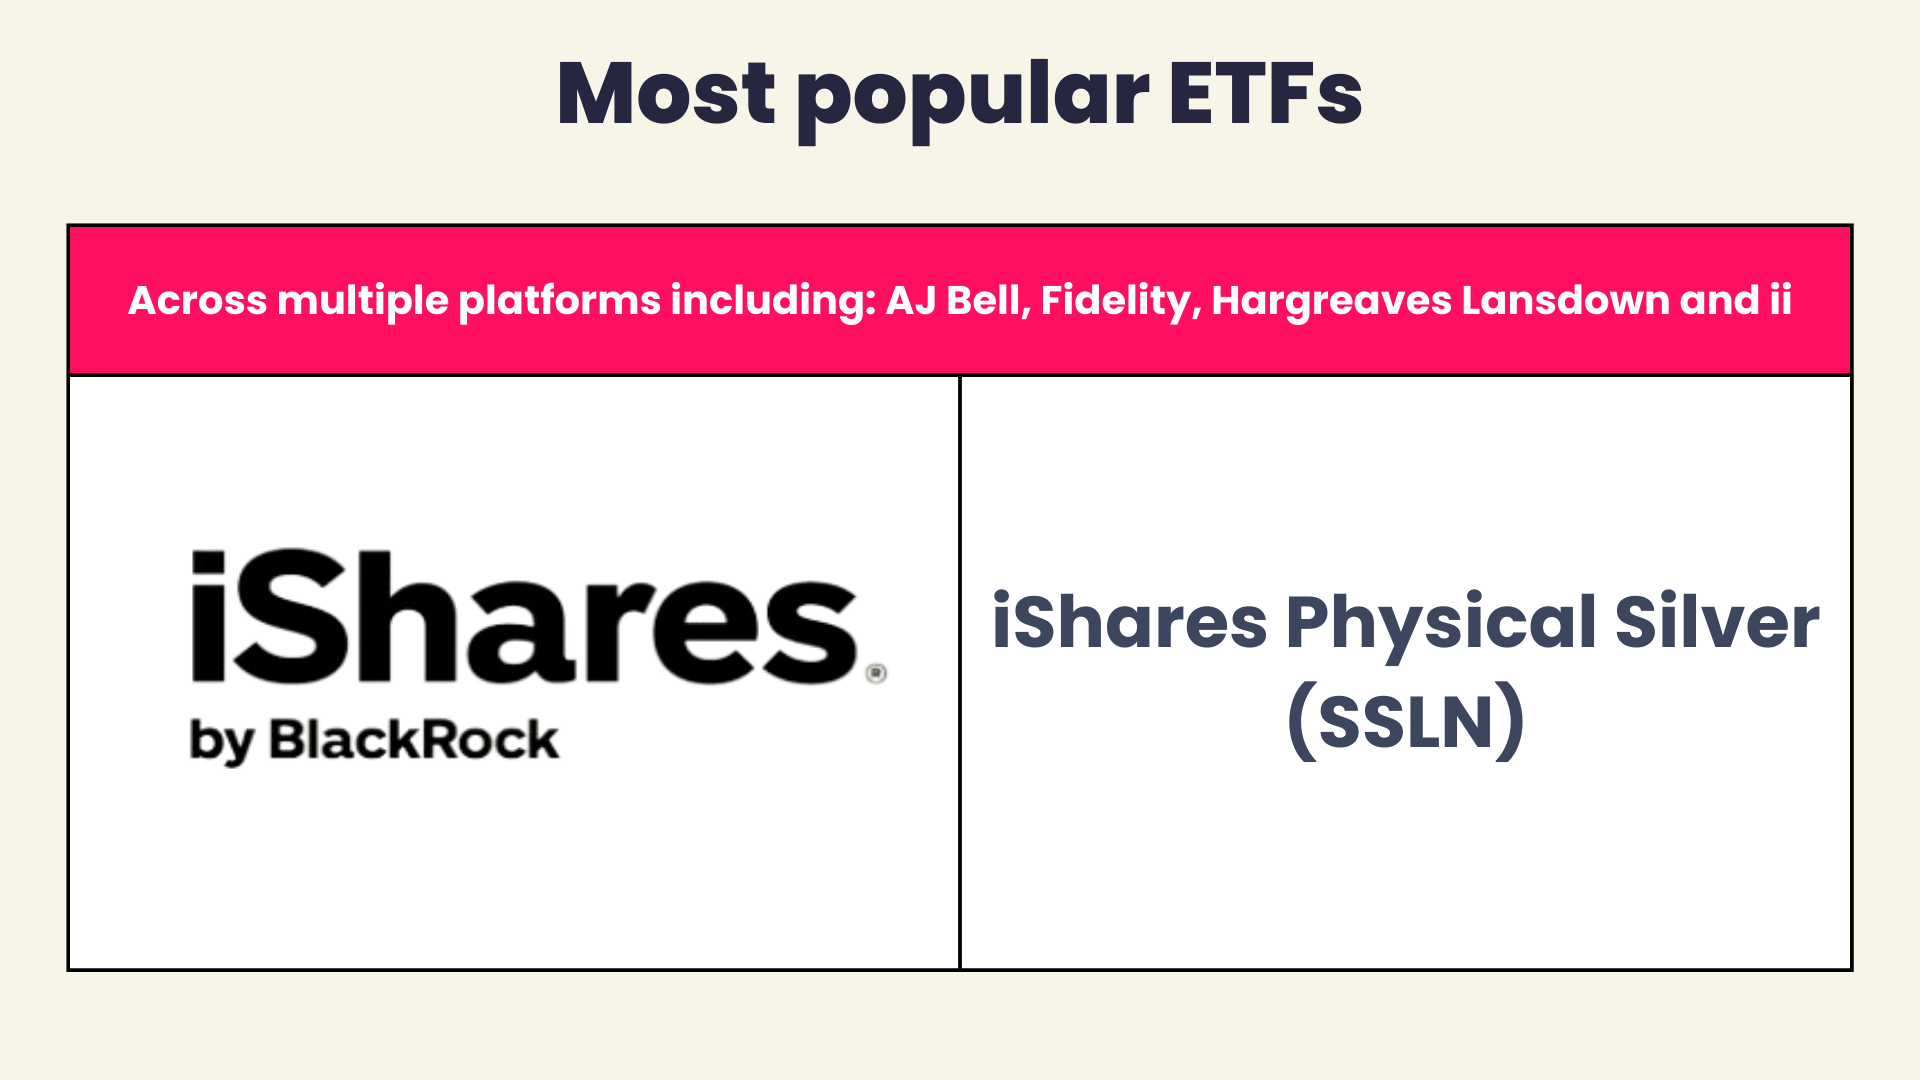
The most popular ETFs across AJ Bell, Fidelity, Hargreaves Lansdown, and interactive investor was iShares Physical Silver ETC (SSLN).
ETF investors continued to embrace technology and US assets. The Vanguard S&P 500 fund appeared across all four platforms. The Vanguard FTSE All World fund also proved popular. Investors on the ii platform were doubling down on the technology trade, with the WisdomTree NASDAQ 100 3x Daily Leveraged GBP and Invesco NASDAQ 100 UCITS among the best-selling funds.
However, the real winners were silver ETFs, which were a feature on all platforms. The iShares Physical Silver fund was among the top five ETFs on every platform, as ETF investors rushed to capitalise on the soaring silver price. The silver price has more than doubled since September[6]. Gold also retained its popularity, with the iShares Physical Gold fund a popular choice.
The UK also appeared to be garnering some attention from ETF investors. The iShares Core FTSE 100 ETF was the top seller on the AJ Bell platform, while the iShares UK Dividend fund was also popular. It is too soon to call a turnaround in attitudes to the UK market, but it is an encouraging sign.
There were a few signs of caution among ETF investors, though the iShares £ Ultrashort Bond fund appeared on the Fidelity platform for the second month in a row. Short-dated bonds tend to be seen as lower risk because there is less risk of default, and they can be used as a proxy for cash.
Best-selling ETFs from AJ Bell
ETF | 3 year performance | 5 year performance | OCF |
iShares Core FTSE 100 ETF GBP Dist (ISF) | 48.3% | 83.6% | 0.07% |
iShares Physical Gold ETC GBP (SGLN) | 111.8% | 130.1% | 0.12% |
iShares Physical Silver ETC GBP (SSLN) | 167.3% | 173.5% | 0.20% |
Vanguard S&P 500 ETF USD Acc GBP (VUAG) | 65.1% | 96.6% | 0.07% |
Vanguard S&P 500 ETF USD Acc GBP (VUSA) | 65.1% | 96.6% | 0.07% |
Vanguard FTSE All-World ETF USD Acc GBP (VWRP) | 56.7% | 72.7% | 0.19% |
Vanguard FTSE All-World UCITS ETF GBP (VWRL) | 56.7% | 72.7% | 0.19% |
iShares Core S&P 500 ETF USD Acc GBP (CSPI) | 65.1% | 96.6% | 0.07% |
iShares UK Dividend UCITS ETF GBP (Dist) (IUKD) | 57.0% | 89.9% | 0.40% |
Global X Silver Miners UCITS ETF (SILG) | N/A | N/A | 0.65% |
Performance figures are retrieved from FE FundInfo on a Total Return is a comprehensive way of measuring investment performance that includes two components: capital appreciation/depreciation (changes in the actual price or value of the investment) and income distributions (any dividends, interest payments, or other distributions paid out during the measurement period)..
Best-selling ETFs from Fidelity
ETF | 3 year performance | 5 year performance | OCF |
Vanguard S&P 500 UCITS ETF GBP (VUAG) | 65.1% | 96.6% | 0.07% |
iShares Physical Gold ETC GBP (SGLN) | 111.8% | 130.1% | 0.12% |
iShares MSCI World Screened (SAWG) | N/A | N/A | 0.20% |
iShares Physical Silver (SSLN) | 167.3% | 173.5% | 0.20% |
Vanguard ESG Global All Cap (USD) Dist (V3AM) | 57.8% | N/A | 0.24% |
Invesco FTSE All-World USD Acc (FWRG) | 120.73% | 172.92% | 0.15% |
iShares £ Ultrashort Bond GBP (Dist) (ERNS) | 15.9% | 17.5% | 0.09% |
Vanguard S&P 500 Inc (VUSA) | 65.1% | 96.6% | 0.07% |
VanEck Morningstar Developed Markets Dividend Leaders (TDGB)* | 52.39% | 129.62% | 0.30% |
iShares Core MSCI World UCITS ETF USD (Acc) (SWDA) | 59.3% | 80.9% | 0.20% |
Performance figures are retrieved from FE FundInfo on a Total Return is a comprehensive way of measuring investment performance that includes two components: capital appreciation/depreciation (changes in the actual price or value of the investment) and income distributions (any dividends, interest payments, or other distributions paid out during the measurement period)..
*Performance figures are retrieved from the London Stock Exchange on 14.01.25
Best-selling ETFs from Hargreaves Lansdown
ETF | 3 year performance | 5 year performance | OCF |
Vanguard S&P 500 USD(GBP) (VUSA) | 65.1% | 96.6% | 0.07% |
iShares Physical Metals plc Physical Silver ETC (SSLN) | 167.3% | 173.5% | 0.20% |
Vanguard FTSE All-World (VWRP) | 56.7% | 72.7% | 0.19% |
Vanguard S&P 500 UCITS ETF USD Acc (VUAG) | 65.1% | 96.6% | 0.07% |
Global X ETFs Silver Miners USD Acc (GBP) (SILG) | N/A | N/A | 0.65% |
Wisdom Tree Silver 3x Daily Leveraged (GBP) (3LSI) | 467.8% | 135.2% | 3.39% |
Invesco Physical Markets plc Physical Silver ETC (GBP) (SLVP) | 167.3% | 173.5% | 0.19% |
Wisdom Tree Physical Silver (GBP) (PHSP) | 164.9% | 169.5% | 0.49% |
Invesco EQQQ NASDAQ 100 (EQQQ) | 108.8% | 103.0% | 0.30% |
Invesco Markets II Plc FTSE All-World USD Acc (FWRG) | N/A | N/A | 0.15% |
Performance figures are retrieved from FE FundInfo on a Total Return is a comprehensive way of measuring investment performance that includes two components: capital appreciation/depreciation (changes in the actual price or value of the investment) and income distributions (any dividends, interest payments, or other distributions paid out during the measurement period)..
Best-selling ETFs from interactive investor
ETF | 3 year performance | 5 year performance | OCF |
iShares Physical Silver ETC (SSLN) | 167.3% | 173.5% | 0.20% |
iShares Physical Gold ETC (SGLN) | 111.8% | 130.1% | 0.12% |
Vanguard S&P 500 ETF USD Acc (VUAA) | 65.1% | 96.6% | 0.07% |
Vanguard S&P 500 UCITS ETF (VUSD) | 65.1% | 96.6% | 0.07% |
Global X Silver Miners ETF USD Acc GBP (SILG) | N/A | N/A | 0.65% |
Vanguard FTSE All-World UCITS ETF (VWRL) | 56.7% | 72.7% | 0.19% |
WisdomTree Physical Silver ETC GBP (PHSP) | 164.9% | 169.5% | 0.49% |
Vanguard FTSE All-World UCITS ETF(VWRD) | 56.7% | 72.7% | 0.19% |
WisdomTree NASDAQ 100 3x Daily Leveraged GBP (LQQ3) | 441.8% | 139.2% | 0.75% |
Invesco NASDAQ 100 UCITS (EQQQ) | 108.8% | 103.0% | 0.30% |
Performance figures are retrieved from FE FundInfo on a Total Return is a comprehensive way of measuring investment performance that includes two components: capital appreciation/depreciation (changes in the actual price or value of the investment) and income distributions (any dividends, interest payments, or other distributions paid out during the measurement period)..
Data provided by FE FundInfo, correct as at 31 December 2025.
---
[1] S&PGlobal
[2] BEA, December 2025
[3] MSCI China Index
[4] FTSE Russell
[5] Fefundinfo 12 January 2026