Buy the dip? More blip than dip.
By Holly Mackay, Founder & CEO
10 April, 2026

Another week of chaos as the Great Unhinged Ruler of America lurched from threat to tweet, unleashing more volatility on markets.
Last week, we asked for your feedback. How are you responding? Interestingly, you’re more rattled by recent events than you were by Covid or Liz Truss’ mini-Budget. Beginner investors are nervous and twice as likely to be planning to sell shares (12% of you) as the more experienced readers. (Before you do, can I suggest you read this article which outlines the biggest crashes in recent history - and what happened over the longer-term as they recovered.)
We had over 450 questions from you. I have read all of them and made a start on answers – you can see them at the bottom of this email. This stuff is generally better as a discussion, so we’re planning an impromptu 45-minute webinar at lunchtime on Tuesday, 21st April, so I can answer as many questions in person as possible. Please do sign up and join us live or watch on catch-up.
Today, I want to tackle the most common narrative, which is people talking about ‘buying the dip’. I’m a bit of a sceptic. Here’s a contrary view to what most of the finfluencers are shouting about online. There isn’t much of a dip. And it’s too risky to chase.
Stay with me on this. Look at the charts below. (Even people who came out in hives at Year 5 Maths – I have de-geekified them!)
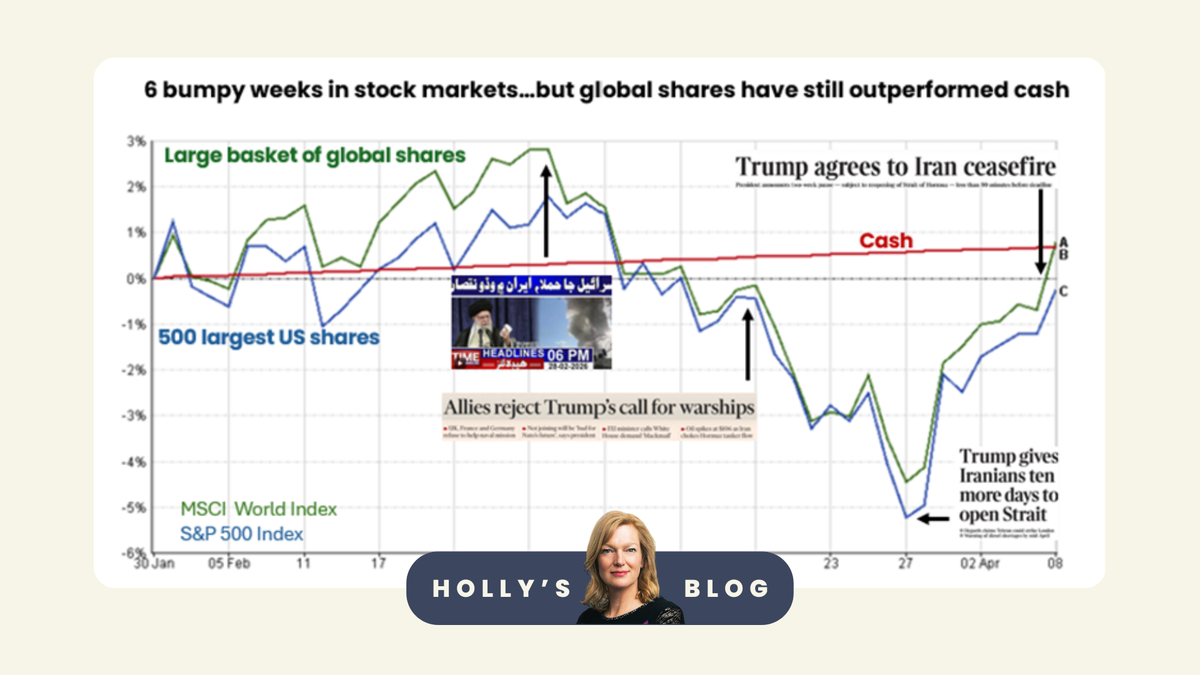
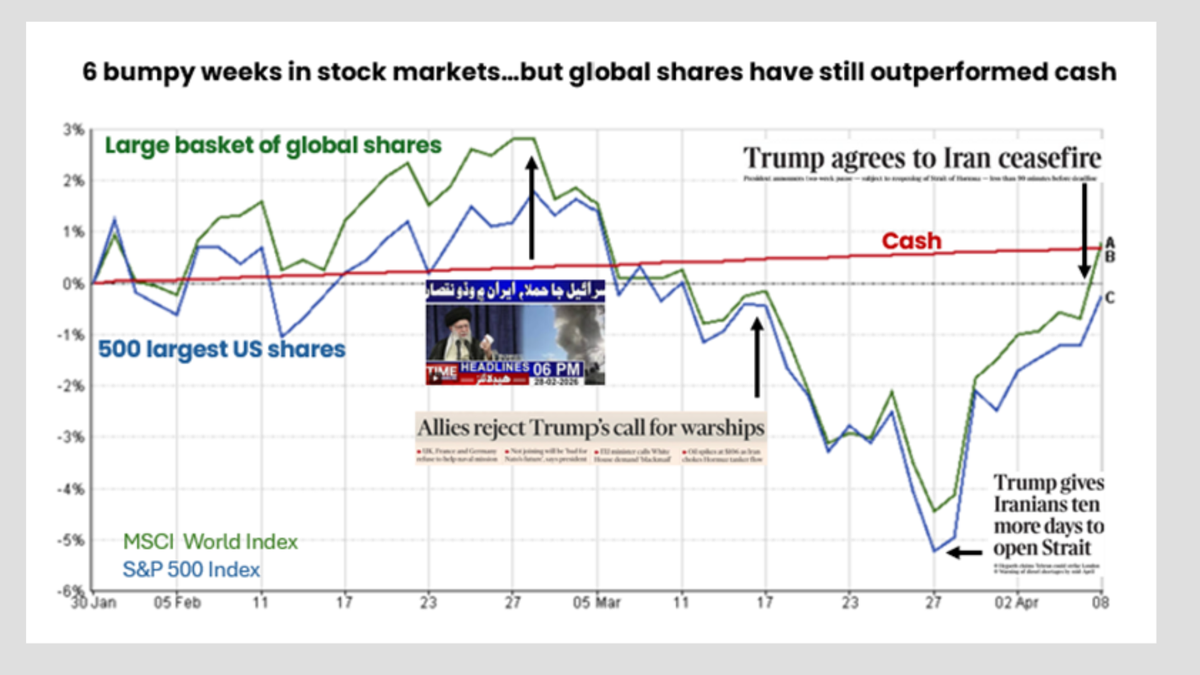
This first chart shows the short-term. This shows the drama we’ve all lived with for the last 6 weeks. It’s a very modern chart which shows social media-infused market volatility – we would never have seen charts like this before technology changed our consumption of news. But there is no long-term dip here to buy. When we look back at long-term charts in a decade, the month of March 2026 will not be more than a tiny blip.
If you’d sold on Friday last week, thinking you’d wait for more bad news and buy any dip, you would have missed a lot of the bounce back by the time you’d had your cornflakes on Tuesday. It’s too risky. We don’t know what the Great Orange One’s stubby fingers are going to poke out on Truth Social next.

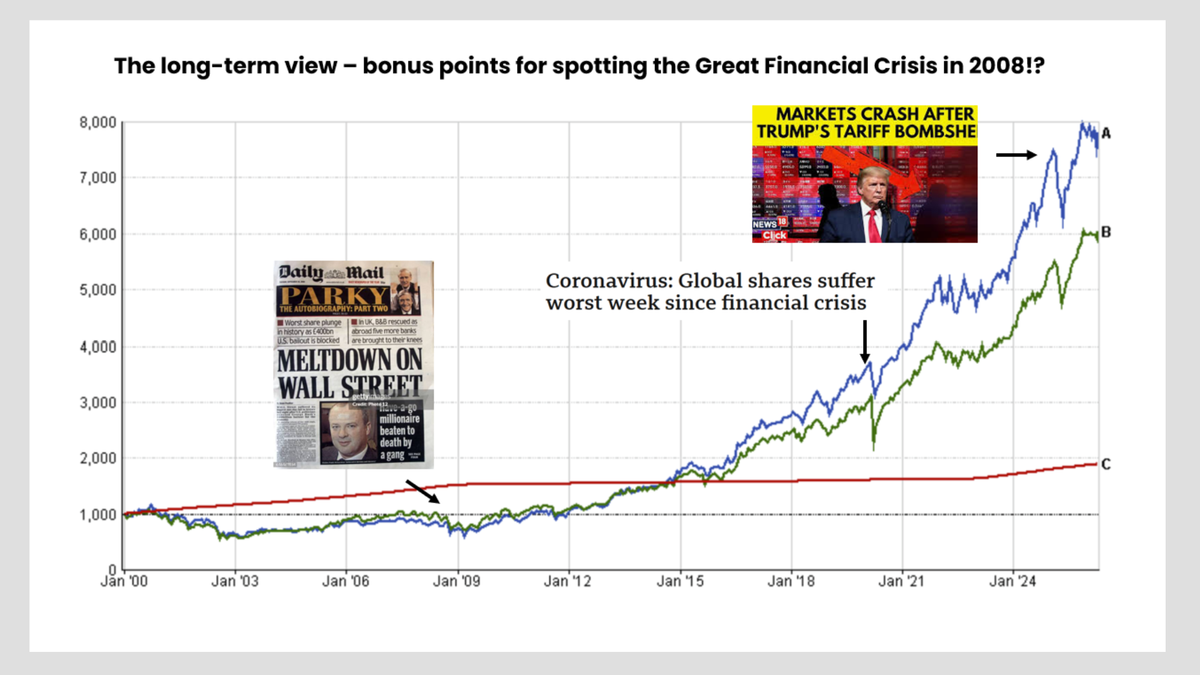
The second chart shows what has happened to cash (orange line) since 2000 compared to money in a massive basket of global shares (green) and the US market (blue). £1,000 in the US stock market in January 2000 would be nearly £8,000 today. Cash would be nudging £2,000.
Look at the lines around the Great Financial Crisis in 2008. This hardly registers. But you can see the fast dips in the knee-jerk social media era, as Covid and tariff-induced Liberation Day falls register. Covid was a dip. Liberation Day was a dip. March 2026? More blip than dip.

It’s not easy trying to work out what’s happening. The S&P 500 remained largely immune as Trump talked about wiping out a civilisation but rallied 2.5% on news of a ceasefire. I don’t think we’re through this yet, and it seems obvious there is an oil-driven economic pile of sludge ahead to wade through – otherwise known as stagflation for our more keen bean(counter) readers. But that’s another story for another day.
Those keen to learn more might like an update on gold, or to check out the answers to some of our reader questions.
Have a great weekend, everyone. Today started well with an early swim in the Solent, which was like a calm bath – 10.7 degrees, no less! When you put your head under that (keeping your mouth shut, obvs), the madness of the world feels very far away.
Holly
Post a comment:
This is an open discussion and does not represent the views of Boring Money. We want our communities to be welcoming and helpful. Spam, personal attacks and offensive language will not be tolerated. Posts may be deleted and repeat offenders blocked at our discretion.