What happens to stock markets after a crash? A history of recoveries
Written by Boring Money
10 April, 2026
Stock markets have always had their wobbles — and right now is no different. But while falling values are never comfortable to watch, history offers a useful reality check. From the 1987 Black Monday crash to the Covid sell-off, markets have taken some serious hits over the decades. They've also recovered every time. Here's a look back at the biggest crashes in stock market history, what caused them, and what they can teach us about staying calm when things get choppy.
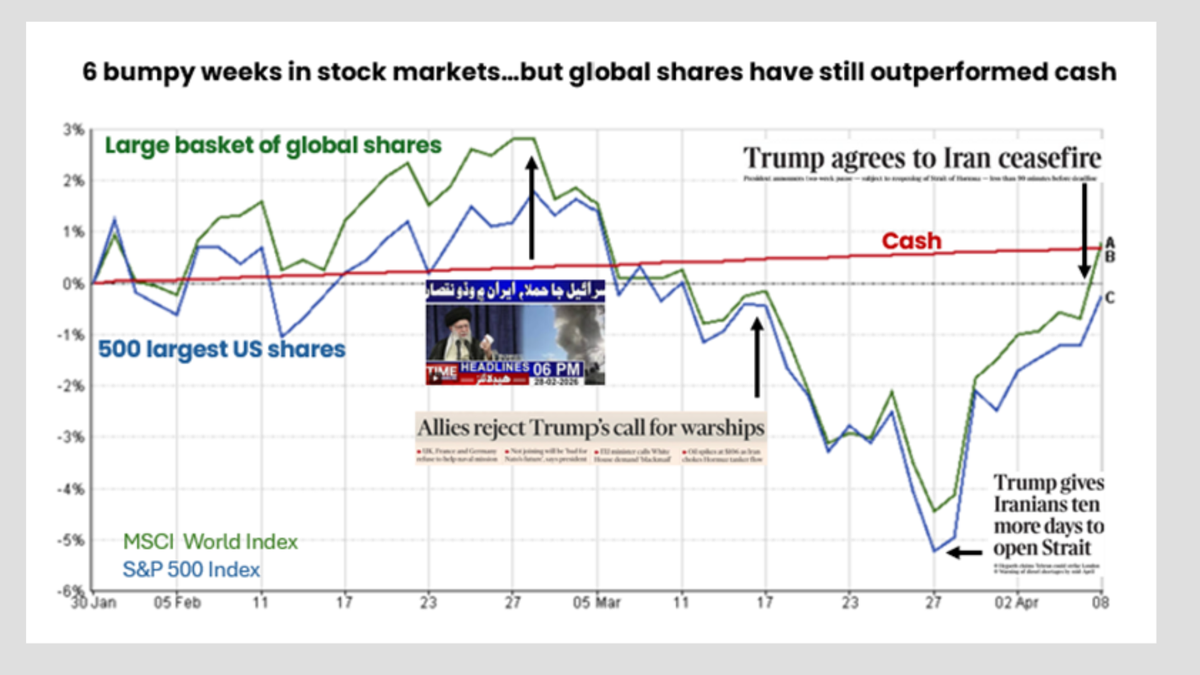
It’s been a bouncy few weeks in stock markets. The potential for higher inflation and interest rates due to rising energy costs has troubled investors. Equally difficult has been the lack of clarity from political leaders about the ambitions and duration of the conflict. Nevertheless, set in the context of history, global stock markets have been relatively well behaved during this recent crisis – so far.
It is always unsettling to watch your savings slide. However, while the circumstances may be new every time, crashes have long been part and parcel of investing in stock markets. History can teach us a thing or two about how markets recover from periods of instability – and may provide a little reassurance.
The trouble with stock markets is that they are created by humans. As such, they are vulnerable to a range of human emotions: fear and greed are the top two, but there are others – the instinct to follow a herd, for example. This means that there will be times when they show excessive optimism and others when they show excessive pessimism. This leads to bubbles and crashes.
However, it is important to look through these ups and downs to harness the higher, long-term returns in stock markets. The long-term growth rate from a portfolio of shares is around 5%[1]. Most importantly, that is a ‘real’ return - i.e. after inflation. More recently, thanks largely to the impact of the US technology giants, that return has been a little higher. The MSCI World index
has delivered an annualised return of 12.4% over the past decade. That means a £10,000 investment would have grown to £34,330.By contrast, holding cash over the past 10 years could have seen the real purchasing power of your savings eroded: savings rates have not always been high enough to beat inflation. The occasional stock market crash is the price investors pay for the higher returns available from stock markets. You don’t get the highs without the lows.
This most recent bout of volatility is mild compared to some of the crashes in history. The S&P 500
was down just under 5% in March, but is only down around 1% for the year to date. The FTSE 100 is still up for the year to date by 6.4%, cushioned by its high weighting in oil, mining and defence companies [2].What happened to markets in the biggest recent stock market crashes?
📅19th October, 1987 – ‘Black Monday’ saw the largest one-day fall in the Dow Jones Industrial Average
in 30 years with the index dropping 508 points, 22.6% of its value [3]. Plenty of investors panicked and sold out, but those who were patient were rewarded. While a £10,000 investment was reduced to £6,610 in a matter of weeks, by 1997 that investment had climbed to £32,690[3].📅10th March, 2000 – the technology-heavy Nasdaq index
peaked at 5,133 [4] only to fall 78% in the following 30 months. The period preceding the slump had every characteristic of a full-blown market bubble. That said, today the Nasdaq sits at over 22,000 [4] and some of the companies caught up in the bubble, such as Amazon, have gone on to make their investors multiple times their initial investment.📅15th September, 2008 – Investors will still remember the savage sell-off in stock markets that followed Lehman Brothers filing for Chapter 11 bankruptcy protection. The bank collapsed under the weight of its debts, triggering a financial crisis that threatened the entire banking system. The FTSE 100 sunk 47% [1], with many of these losses caused by the banks, which saw savage falls. Those who bought at the peak had to wait until May 2013 for the FTSE 100 to recoup its losses, but they would have kept receiving their dividends
in most cases and would now be well ahead.📅6th May, 2010 – US stock market Flash Crash - The Dow Jones Industrial Average suffered its worst intra-day point loss, dropping nearly 1,000 points [3], before recovering almost all of its losses moments later. The crash – thought to have been caused by algorithmic trading – lasted just 36 minutes.
📅March, 2020 - The uncertainty created by the Covid crisis sent stocks tumbling in early 2020. The FTSE 100 fell from around 7,500 in January to as low as 5,670 in March, a drop of around 25% [1]. This beat ‘Black Monday’, but didn’t compete with some of the falls seen in response to the global financial crisis or the unwinding of the technology bubble.
In every one of these cases, markets have bounced back and resumed their rise higher. The FTSE 100, for example, is now at 10,560. Investors will have had dividends as well during that period. The Nasdaq sits at an astonishing 22,600, a 4-fold increase from its lows in 2000. Markets tend to reward patience.
Of course, there are exceptions to the ‘always bounces back’ rule: Japan, for example, saw an asset bubble in the late 1980s and the Nikkei
took until 2023 to recover the same level. That’s too big an opportunity cost for most investors. There are also specific sectors that have been through periods of high valuations and struggled to recover. The key is not to put all your eggs in one basket, but instead to spread your investments across sectors and geographic regions. And not to panic. We have been here before…—————
[1] Barclays, May 2025
[2] Market Watch
[3] Market Watch