Best-performing robo portfolios and ready-made funds in Q3 2022
21 Oct, 2022
The following table displays performance data across robo portfolios and ready-made funds for the Q3 period between 1 July 2022 and 30 September 2022.
This year has seen choppy waters across equities and bonds, and robo portfolios and ready-made funds haven't managed much plain sailing either. We've rounded up the Q3 performance of the most popular of these portfolios and funds on the market, so you can see what's going on with your investments, as well as how returns have developed since the start of the year.
Robo portfolios and ready-made funds across all risk levels - high, medium and low - have all been included and ranked from highest to lowest Q3 net growth (after charges). We've also included their performance in the YTD for your comparison. Scroll down to read more about how we've crunched the numbers.
Q3 robo portfolios and ready-made funds performance for all risk levels
Data correct as at October 2022
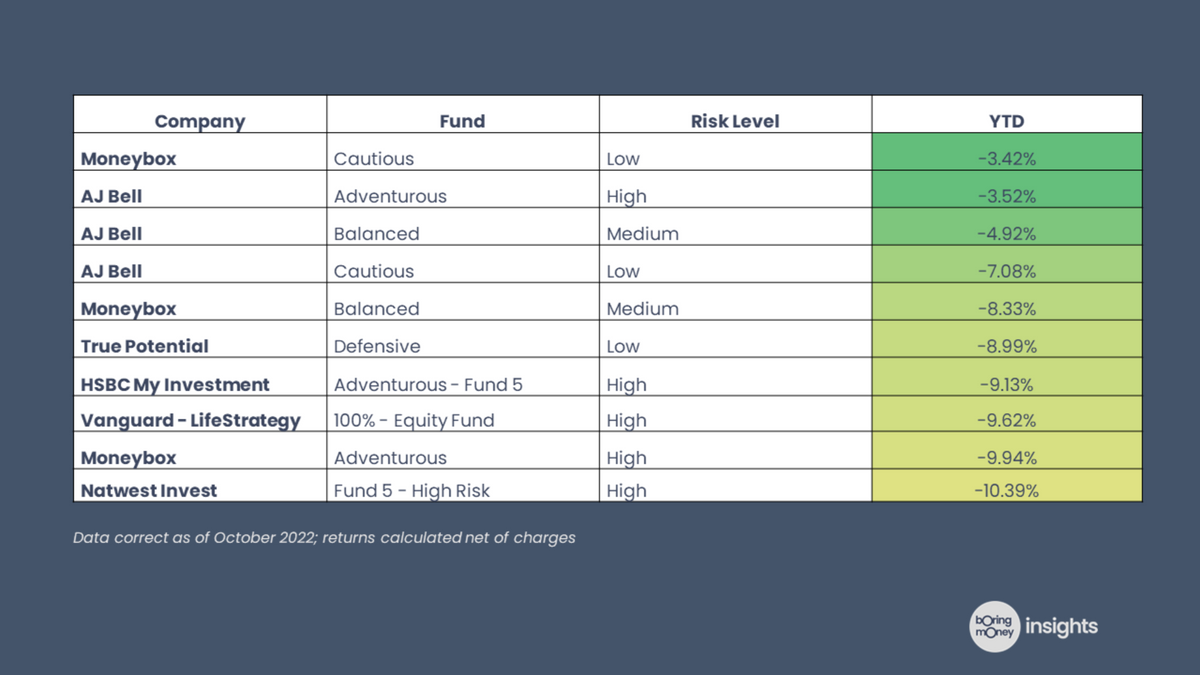
Top 10 robo portfolios and ready-made funds in 2022 (1 Jan 2022 – 30 Sep 2022)

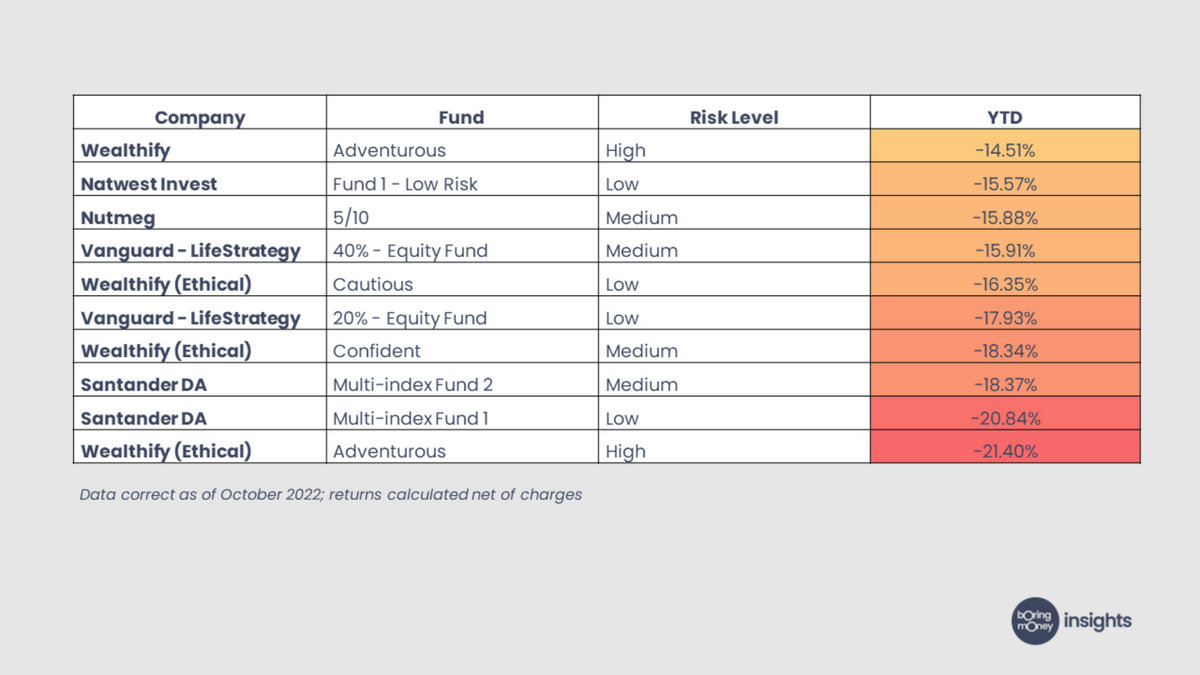
Bottom 10 robo portfolios and ready-made funds in 2022 (1 Jan 2022 – 30 Sep 2022)

Q3 robo portfolios and ready-made funds performance broken down by risk level
Want to see the top 5 best-performing robo portfolios and ready-made funds for each risk level? We've got you covered!
Key terms:
Provider
The investment provider that manages your robo portfolio or ready-made fund.
Portfolio/Fund
The name of the robo portfolio or ready-made fund that is allocated to you by your investment provider. This will typically include a mixture of cash, bonds and shares at different proportions depending on your chosen risk level.
Risk Level
The perceived level of risk associated with your robo portfolio or ready-made fund. There are three main risk categories - low, medium and high - which we assign to each. Read more about how we allocate risk levels in 'Our Methodology' below.
Q3 2022
'3rd quarter'. The period between 1 July 2022 and 30 September 2022.
Q4 2021
'4th quarter'. The period between 1 October 2021 and 31 December 2021.
YTD
'Year-to-date'. The period between 1 January 2022 and the time that our data was collected (in this case, 30 September 2022).
Net Growth
The total growth of a portfolio or fund minus charges.
Our methodology
Boring Money holds test accounts with all of these providers and we use them to look at how our investments have changed on a monthly basis. Net growth refers to growth minus charges. Risk levels are based on equity allocation. For the purposes of this exercise, funds with an equity exposure of under 30% are considered low-risk, funds with 70+% equity are high-risk, and the rest are categorised as medium-risk.