




Best performing ready-made solutions of July – September 2025
Discover which portfolios were top of the pops
By Boring Money
16 Oct, 2025
Every three months we get performance data from the leading ready-made investment portfolios made available to retail investors. We group these into three The uncertainty or potential of significant price fluctuations on an investment. categories and take a look at who has performed best over various timeframes after all fees and charges have been taken into account.
Important stuff: Our content is aimed to help readers’ understanding but it does not constitute any form of advice or recommendation. Investing is a long-term process, and shorter-term performance information alone won’t support robust choices. Investments can and will go up and down in value.
Click to download the full results
How did ready-made solutions perform in Q3 2025?
Ready-made solutions recorded an excellent Q3 as global stock markets continued to hit new heights. AI optimism drove markets, alongside a strong earnings report season and interest rate cuts.
Although concerns of a bubble are growing - with "safe haven" asset gold featuring in headlines frequently thanks to its continued surge (alongside other precious metals) - markets continue to march forward for the time being.
Every ready-made solution we track posted a positive return in what was a textbook quarter; all high risk solutions outperformed their medium risk counterparts, who in turn all outperformed low risk solutions. This is what theory would suggest happens in "normal" quarters, with equity outperforming bonds, and portfolios with higher allocations to shares therefore doing better.
The average return of a high risk portfolio was 8.3%, which is equivalent to £83 profit on a £1,000 investment over the past 3 months. Medium risk portfolios returned an average of 5.7%, whilst low risk portfolios came in with an average of 3.0%. These are very good results, comfortably surpassing Q2's figures (which were also positive).

Average performance of each risk category
The table below illustrates the average performance of ready-made solutions from the three risk categories - high, medium and low - across the different time periods we track:
Risk Level | Q3 2025 AVERAGE NET GROWTH | 1 YEAR AVERAGE NET GROWTH | 3 YEAR AVERAGE NET GROWTH | 5 YEAR AVERAGE NET GROWTH |
High Risk | 8.3% | 13.6% | 43.8% | 63.9% |
Medium Risk | 5.7% | 9.3% | 31.7% | 35.4% |
Low Risk | 3.0% | 4.9% | 18.3% | 11.3% |
Disclaimer: Investing is a long-term process, and investment decisions must not be based solely on past performance, especially over short timeframes.
High risk ready-made solutions
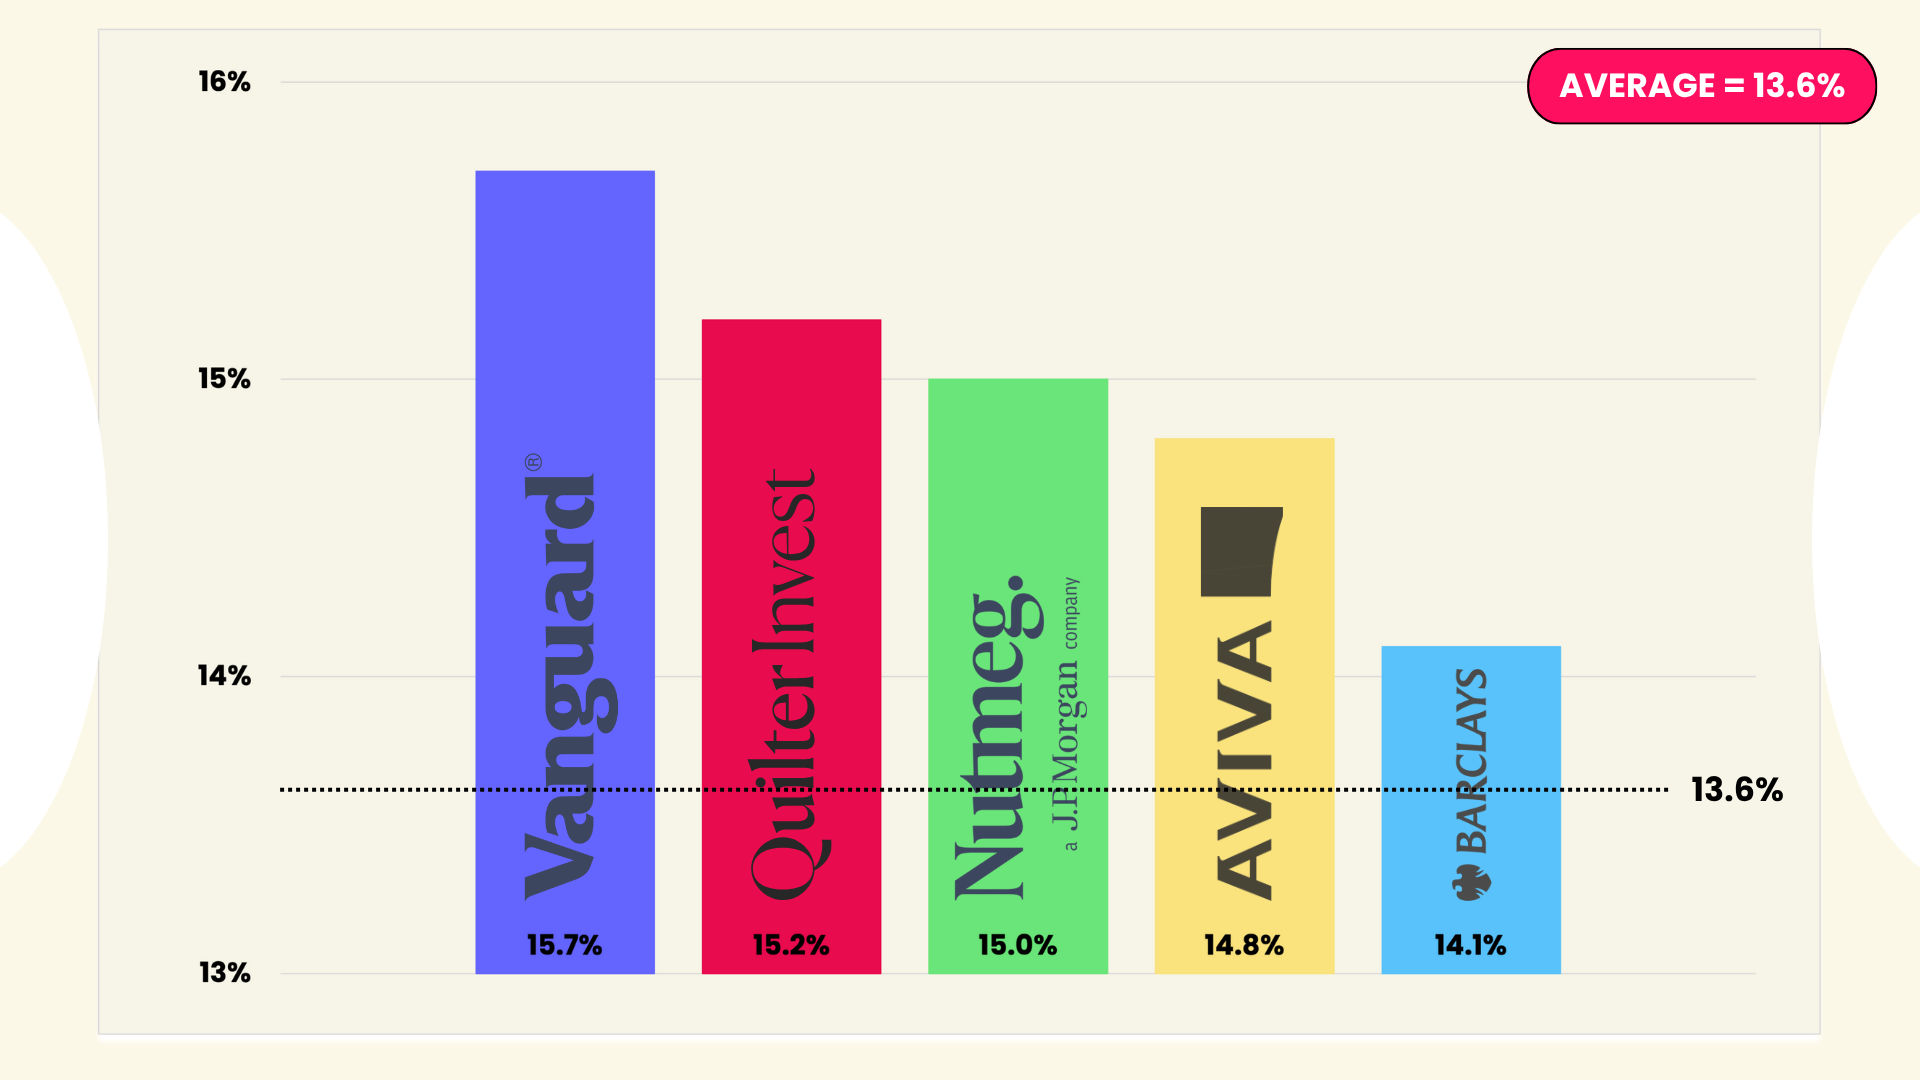
Graph illustrating net returns for one year covering October 2024 - September 2025 of the top 5 performing ready-made solutions against the average of all of the high risk funds/portfolios covered in our analysis. Data correct as at 30 September 2025. Returns calculated net of charges. The full fund/portfolio names can be found in the table below.
Quilter's Cirilium Adventurous Passive portfolio is in the top 3 performers across all timeframes covered. Vanguard & Nutmeg's high risk solutions complete the top 3 for the 1, 3 & 5-year time periods.
Q3 was an excellent quarter for markets, fuelled by increasing AI optimism and a strong earnings season. Various large tech companies beat analyst estimates and committed to significant investment. Against a backdrop of positive international trade deals in key sectors, this sent markets soaring.
The An index that tracks the performance of the 500 largest publicly traded companies in the United States. It's often used as a benchmark for the overall global stock market. and tech-focused An American index primarily known for listing prominent technology companies. both hit new highs, having risen steadily throughout the quarter alongside the UK's Also called “Footsie”, the name for the share index made up of the largest 100 companies by market capitalisation (total value of all shares) listed on the London Stock Exchange., which grew by 6.7% over the period.
The average high risk portfolio returned 8.3%, with returns ranging from 6.9% - 8.9%. Halifax, the lowest performer last quarter, topped the leaderboard in Q3, closely followed by Aviva and Quilter Invest.
Interestingly, Halifax have one of the lowest equity allocations out of the providers covered in the high risk segment, with 89% of assets held in shares, compared to the average of 94%. The Halifax fund also reduced its ongoing charges in Q3 to 0.10%, making it among the cheapest options in the market. There is a £3 per month platform charge when investing in Halifax portfolios, which can adversely affect smaller portfolios. However, this fee structure represents increasingly good value as portfolio size increases. An investor with £10k in Halifax's high risk option would have seen returns of over £900 in the past 3 months.
Q3's strong performance boosted overall 1-year returns, which are double-digit across the board, ranging from 11% - 15.7%. Vanguard, Quilter Invest, and Nutmeg are the top 3 performers over the past 12 months. In fact, these providers occupy the top 3 slots across all the longer timeframes, returning between 47% and 52% over the past 3 years, and are the only providers with growth above 70% in the past 5 years. On the opposite end of the list is Charles Stanley, who has returned the least across all 4 time periods, with its 5-year return of 39.8% lagging nearest competitor Wealthify by over 10%.
Vanguard, Quilter, and Nutmeg's portfolios all have an equity allocation of above 90% in developed markets. Of the three, Quilter has the highest allocation to A country with an economy considered to be at an earlier stage of development than a more established country - e.g. India compared to the USA., with 9% of assets (the vast majority of these held in Asian regions). The majority of its underlying assets are invested in BlackRock index funds. 11% of assets are held in Eurozone territories, which is close to double Vanguard's LifeStrategy 100 allocation to the region, whilst roughly 23% of assets are held in the UK.
Vanguard has a similar UK allocation, whilst Nutmeg opts for a lower proportion at roughly 15%. Both Nutmeg and Vanguard opt for circa 5% of assets to be held in Japan, whilst Quilter has the largest allocation to the Middle East, although this only makes up roughly 1% of the overall portfolio.
Provider | Fund / Portfolio | Risk Level | Q3 2025 Net Growth | 1 Year Net Growth | 3 Year Net Growth | 5 Year Net Growth |
Halifax | Managed Growth 6 | High | 8.9% | 13.2% | 41.6% | 55.6% |
Aviva | Multi-asset Plus V | High | 8.9% | 14.8% | 44.9% | 67.9% |
Quilter Invest | Cirilium Adventurous Passive | High | 8.8% | 15.2% | 47.8% | 76.2% |
Vanguard | LifeStrategy 100 | High | 8.7% | 15.7% | 52.0% | 78.9% |
HSBC | Adventurous | High | 8.6% | 13.5% | 43.1% | 68.3% |
Moneybox | Adventurous | High | 8.3% | 12.6% | 41.6% | 69.0% |
AJ Bell | Adventurous | High | 8.1% | 13.2% | 39.5% | 65.6% |
Barclays | Global Markets Adventurous | High | 7.9% | 14.1% | 44.5% | 58.9% |
Wealthify | Adventurous | High | 7.9% | 12.0% | 42.0% | 50.9% |
Hargreaves Lansdown | Adventurous Managed | High | 7.9% | 13.0% | N/A | N/A |
Charles Stanley | Multi Asset Adventurous | High | 6.9% | 11.0% | 36.1% | 39.8% |
Nutmeg | 10 | High | - | 15.0% | 48.8% | 71.3% |
This table displays performance over multiple timeframes across the past 5 years for a range of investment funds/portfolios. Performance has been calculated net of investment and platform charges. Risk levels have been classified based on Boring Money’s parameters, which can be found in the ‘key terms’ and 'methodology' sections below. Performance figures have either come directly from platforms or been estimated using the value of fund assets, assuming frequent rebalancing.
Medium risk ready-made solutions
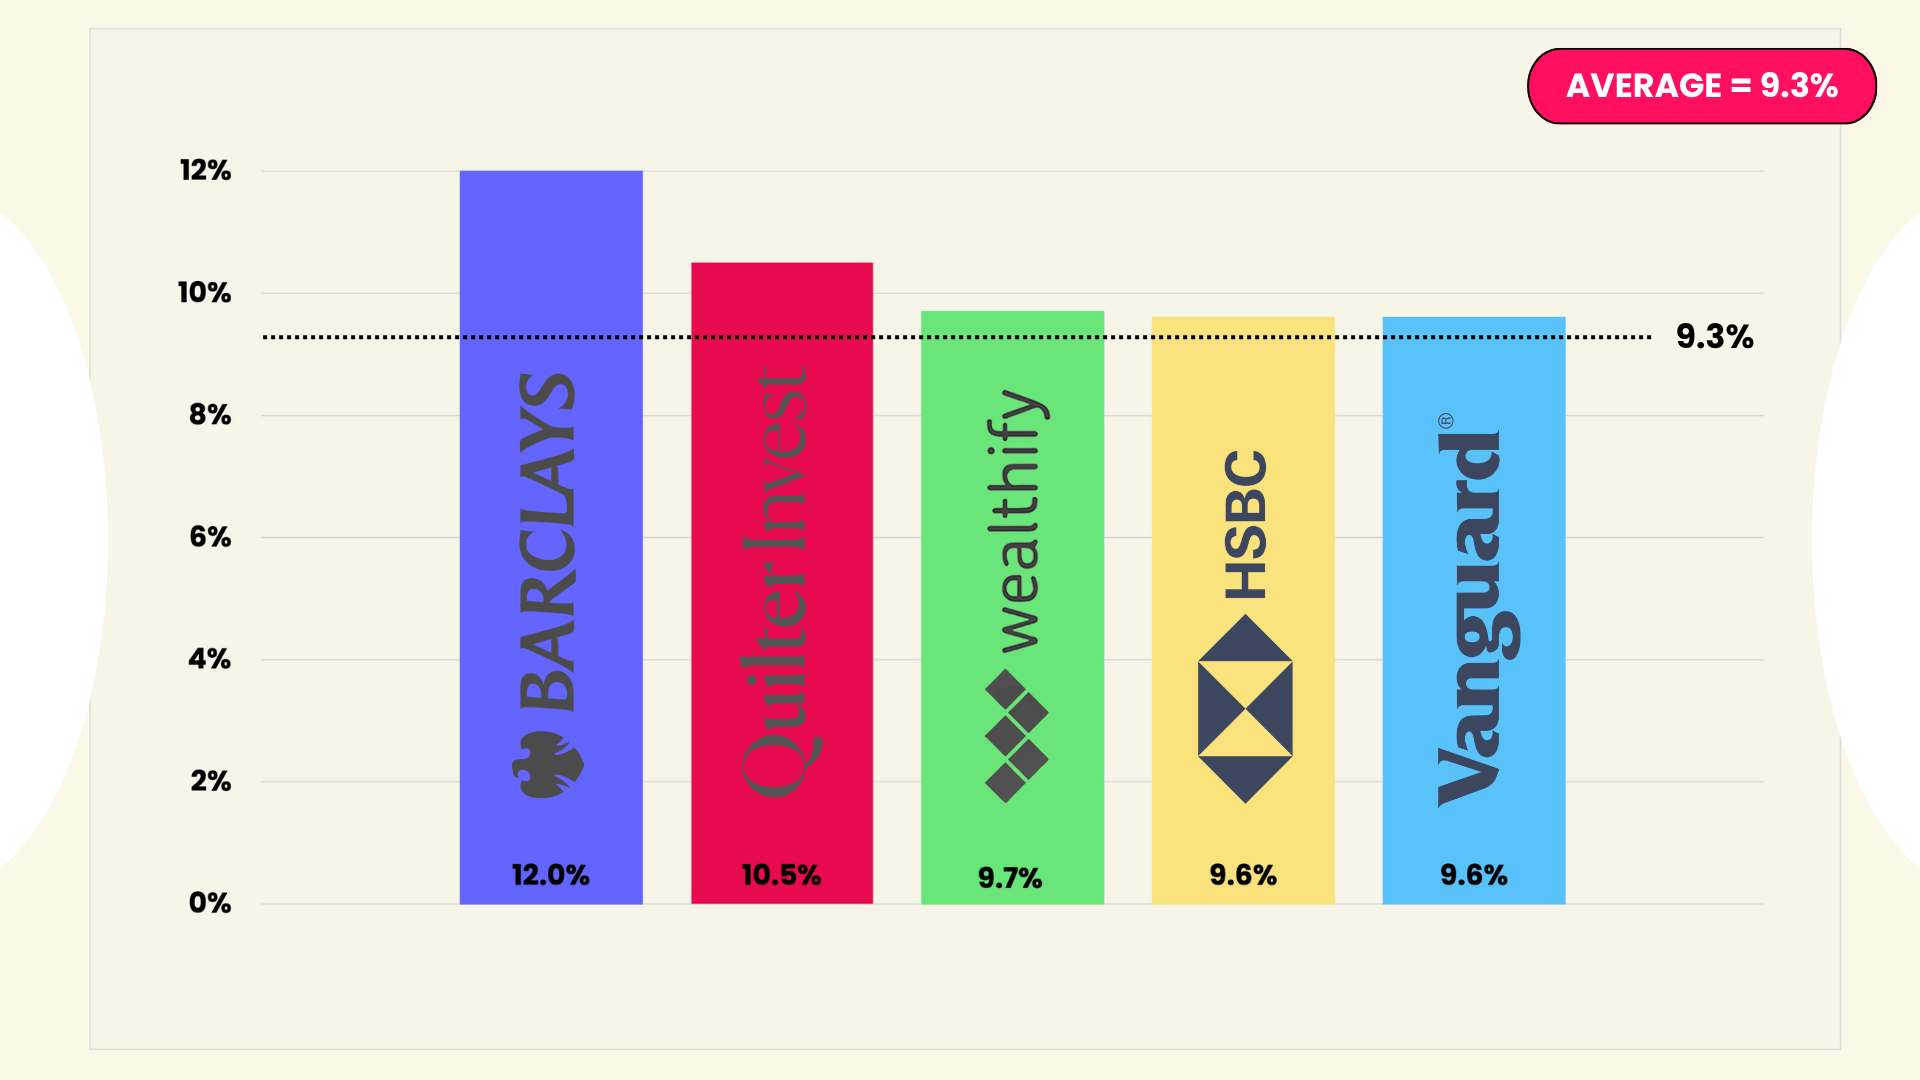
Graph illustrating net returns for one year covering October 2024 - September 2025 of the top 5 performing ready-made solutions against the average of all of the medium risk funds/portfolios covered in our analysis. Data correct as at 30 September 2025. Returns calculated net of charges. The full fund/portfolio names can be found in the table below.
Barclays Global Markets Growth fund is the top medium risk performer across all timeframes covered. Barclays and Quilter's solutions posted returns in excess of 40% over 5 years.
The average medium risk portfolio returned 5.7% in Q3. Charles Stanley, who was top of the charts last quarter, was the lowest performer this time around - although its 4.3% return was still higher than all the medium risk portfolios in Q2.
The top performer in Q3 was Barclays, with growth of 6.7%. Impressively, Barclays is the best performing in this category across all time periods, returning 12% in the last year and 39.7% across the past 3 years.
Barclays has roughly 2/3 of the portfolio in equities and 1/3 in bonds. Unsurprisingly, assets are predominantly held in the US, with a 63% allocation. The second largest region is Asia, with 19% of the portfolio. Interestingly, there is a 7% allocation to emerging Asian markets, which is over 2x the average of benchmark funds. The Eurozone is the third largest region with roughly 10% of assets, whilst only 3% of assets are held in the UK, which is far below the 17% average seen in the broader benchmark.
Barclays explicitly highlights the active nature of the fund's management in the investment policy and also mentions that the manager will not select assets based on any index or benchmark. Generally, the more Run by a professional or group of experts, usually called portfolio managers or fund managers, who make decisions about what to buy to try and outperform the market for their customers. the fund, the higher the A charge that you pay to an investment manager for their services. This is usually shown as a percentage, for example 1%, of the total amount invested per year.. In this case, Barclays' investment managers have opted for more tech, which makes up 28% of all equity holdings.
The 12-month average return across all medium risk portfolios was 9.3%, with individual solutions ranging from 7.8% - 12%. Other than Barclays, Quilter was the only provider to reach double-digit growth with a 10.5% return over the year.
Wealthify and Vanguard join Barclays in the top 3 over the longer 3-year timeframe, although results are much more clustered over this period. Despite all having unique approaches to asset allocation and stock selection, 6 of the 10 providers had returns between 31.5% - 33.5%. Barclays was the only real positive exception to this, with their 39.7% return over 6% higher than Wealthify in 2nd place.
Across a 5-year period, the picture changes, with different frontrunners and wider dispersion. Barclays retains the top spot comfortably with 47% growth, followed by Quilter with 42%, and then HSBC with 38%. It's also interesting to observe the difference between 3-year and 5-year returns, with providers like Nutmeg and Charles Stanley actually performing better over 3 years than 5 years once you factor in fees.
One of the differentiating factors between medium risk portfolios is how they perform in contrasting market conditions, which is down to decisions around equity and bond allocation. The financial environment between Q4 2020 - Q3 2022 was distinctly different to current conditions, with markets reacting to Covid and rising inflation. AJ Bell performed well in that period and was the only provider to return over 10% across those 2 years, boosting them from second-bottom position in the 3-year rankings to 4th spot across the 5-year timeframe.
Provider | Fund / Portfolio | Risk Level | Q3 2025 Net Growth | 1 Year net Growth | 3 Year Net Growth | 5 Year Net Growth |
Barclays | Global Markets Growth | Medium | 6.7% | 12.0% | 39.7% | 47.3% |
Wealthify | Ambitious | Medium | 6.4% | 9.7% | 33.5% | 36.3% |
AJ Bell | Balanced | Medium | 6.3% | 8.7% | 27.0% | 37.9% |
HSBC | Balanced | Medium | 6.1% | 9.6% | 31.5% | 38.3% |
Quilter Invest | Cirilium Moderate Passive | Medium | 6.0% | 10.5% | 32.9% | 42.2% |
Halifax | Managed Growth 4 | Medium | 6.0% | 8.9% | 32.7% | 34.4% |
Vanguard | LifeStrategy 60 | Medium | 5.3% | 9.6% | 33.0% | 34.3% |
Aviva | Multi-asset Plus II | Medium | 5.1% | 8.9% | 28.0% | 29.3% |
Hargreaves Lansdown | Balanced Managed | Medium | 4.9% | 8.0% | N/A | N/A |
Charles Stanley | Multi Asset Moderate | Medium | 4.3% | 7.8% | 26.8% | 23.2% |
Nutmeg | 6 | Medium | - | 8.6% | 31.9% | 31.2% |
This table displays performance over multiple timeframes across the past 5 years for a range of investment funds/portfolios. Performance has been calculated net of investment and platform charges. Risk levels have been classified based on Boring Money’s parameters, which can be found in the ‘key terms' and 'methodology' sections below. Performance figures have either come directly from platforms or been estimated using the value of fund assets, assuming frequent rebalancing.


Looking to retire with peace of mind?
With the ii personal pension (SIPP), know your money is working hard for your retirement - so you don’t have to. With a low flat fee, you pay the same amount no matter how much your pension grows in value, so you keep more money for the retirement you deserve.
Choose how much and when you invest. With one of the widest choice of investments, you have more flexibility in choosing what best suits your goals. Don’t know what to pick? You can opt for the ready-made funds, hand-picked by experts. Investing doesn’t have to be complex.
There’s even more. ii’s personal pension lets you retire on your own terms. Once you’re ready to take money from your pension, choose from a range of retirement options and make the most of the tax benefits in SIPPs.
Now when you open an ii SIPP this month you get £200 cashback. Min deposit or transfer of £15,000. Offer ends 31 October. Terms apply. Capital at risk.
FIND OUT MORE
Low risk ready-made solutions
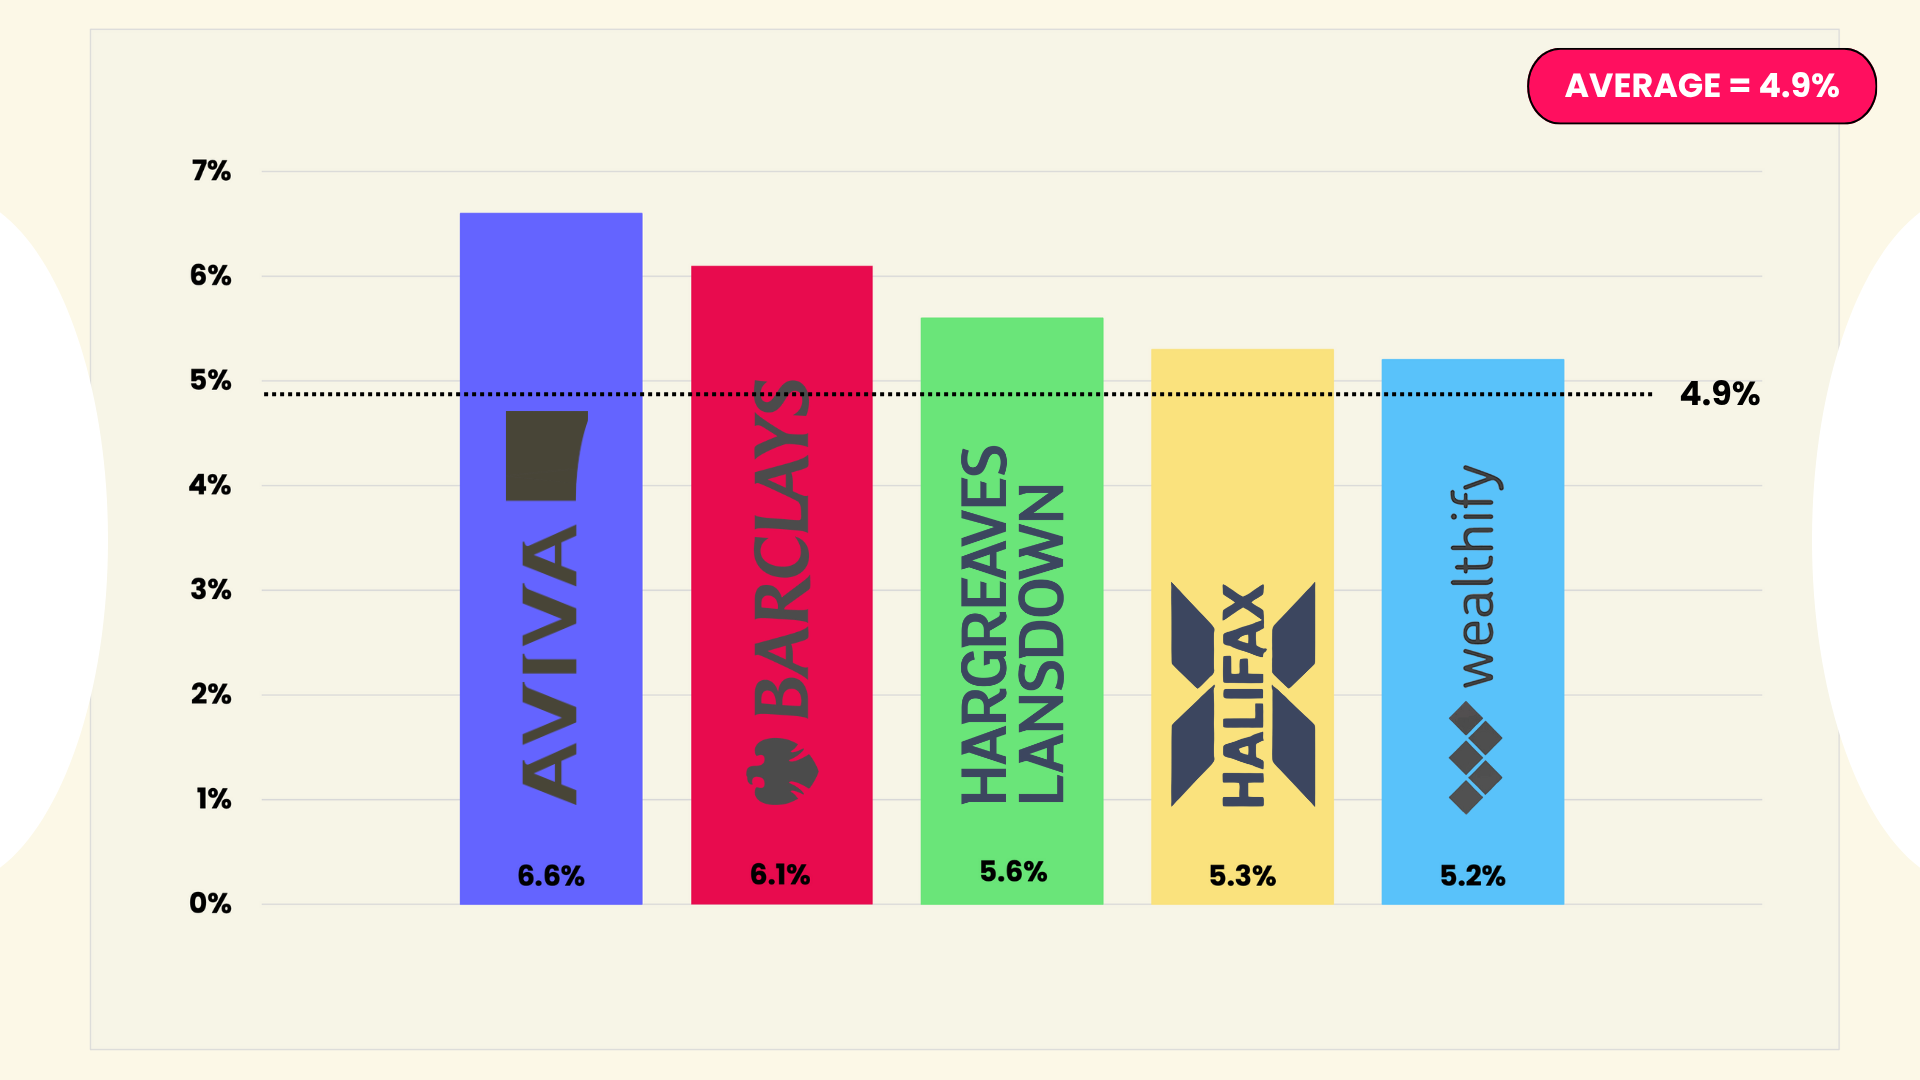
Graph illustrating net returns for one year covering October 2024 - September 2025 of the top 5 performing ready-made solutions against the average of all of the low risk funds/portfolios covered in our analysis. Data correct as at 30 September 2025. Returns calculated net of charges. The full fund/portfolio names can be found in the table below.
Aviva's Multi-asset Plus I fund is in the top 3 performers across all timeframes covered. Halifax's low risk solution is the top performer in Q3 and over 3 years. When looking at a longer time period of 5 years, Hargreaves Lansdown's Cautious Managed fund outperformed the other funds in this category by 7% or higher.
The average low risk portfolio returned 3.0% in Q3, led by Halifax who grew by 3.7%. Halifax hold roughly 77% of its portfolio in bonds, with 44% held internationally and 33% held in the UK. There is also a small allocation to emerging markets which have performed particularly well since the de-escalation of the global tariff tension in April.
Across the 1-year period, returns spanned from 3.5% - 6.6%, with Aviva and Barclays the only two providers to exceed the 6% mark. Vanguard came at the tail end of this list, the only provider to post less than 4% over the year.
Aviva has a 68% bond allocation, with 32% in equities. Bonds are made up of both sovereign and corporate, with Aviva opting for highly A letter grade given to the issuer of a bond to indicate its "quality" - that is, the likelihood that the issuer will be able to keep up with their repayments and not default. The biggest bond credit rating agencies in the world are Standard & Poors, Moody's and Fitch. companies/regions. Roughly 95% of the bonds within the fund have a rating of BBB and above. In terms of equities, the largest sector is financials, which makes up 9% of the overall portfolio.
Halifax and Aviva are the frontrunners over 3 years, with Halifax's 24.4% return substantially above the average of 18.3%. Charles Stanley's actively managed portfolio also performs well across both 3 and 5 years, coming 3rd and 2nd respectively. The portfolio has the largest equity allocation of all the providers in the list; its chunky 34% is substantially above the average of roughly 25%.
Generally, higher equity allocation is associated with higher returns (and Describes the price movement of an investment or index. High volatility indicates frequent and significant price movement, whereas low volatility denotes less frequent or severe fluctuations in price.), but it's clear that there is more nuance to the picture, as despite its high equity allocation and the strong performance of shares, Charles Stanley is not in first place.
Instead, it is Hargreaves Lansdown who sit comfortably at the summit over 5-years with 22.2% growth, which is a significant 7% higher than its nearest competitor, and almost double the 11.3% average return in this category. The foundation of this can be attributed to relatively strong performance in the earlier part of the 5-year period.
Interestingly, every single provider except Hargreaves Lansdown and Moneybox had better 3-year than 5-year performance, with Vanguard, Halifax, HSBC and Barclays seeing losses of over 10% between Q4 2020 and Q3 2022. This was during a very challenging environment for bonds, particularly in the UK.
Provider | Fund / Portfolio | Risk Level | Q3 2025 Net Growth | 1 Year net Growth | 3 Year Net Growth | 5 Year Net Growth |
Halifax | Managed Growth 2 | Low | 3.7% | 5.3% | 24.4% | 12.6% |
Aviva | Multi-asset Plus I | Low | 3.5% | 6.6% | 21.8% | 14.1% |
Hargreaves Lansdown | Cautious Managed | Low | 3.3% | 5.6% | 18.4% | 22.2% |
AJ Bell | Cautious | Low | 3.2% | 4.1% | 14.5% | 12.9% |
Wealthify | Tentative | Low | 3.2% | 5.2% | 18.7% | 10.4% |
Moneybox | Cautious | Low | 3.1% | 4.6% | 11.1% | 12.6% |
HSBC | Cautious | Low | 2.9% | 4.0% | 17.0% | 5.8% |
Quilter Invest | Cirilium Conservative Passive | Low | 2.7% | 5.1% | 18.5% | 10.3% |
Charles Stanley | Multi Asset Cautious | Low | 2.6% | 4.8% | 19.8% | 15.2% |
Barclays | Global Markets Defensive | Low | 2.4% | 6.1% | 18.9% | 8.0% |
Vanguard | LifeStrategy 20 | Low | 2.0% | 3.5% | 16.6% | 1.2% |
Nutmeg | 2 | Low | - | 4.6% | 19.5% | 10.6% |
This table displays performance over multiple timeframes across the past 5 years for a range of investment funds/portfolios. Performance has been calculated net of investment and platform charges. Risk levels have been classified based on Boring Money’s parameters, which can be found in the ‘key terms’ and 'methodology' sections below. Performance figures have either come directly from platforms or been estimated using the value of fund assets, assuming frequent rebalancing.
Disclaimer: Investing is a long-term process, and investment decisions must not be based solely on past performance, especially over short timeframes.
Key terms
Provider
The investment provider offering and managing the fund/portfolio or ready-made solution (see definition below).
Fund/Portfolio
The name of the particular fund/portfolio held on the investment provider’s platform. This will typically include a mixture of cash, bonds, and shares at different proportions depending on your chosen risk level. All funds/portfolios included in this article can also be classified as ready-made solutions - which you can learn more about in our guide here.
Equities
Another name for 'shares' or 'stocks', equities are small slices of a company which investors can buy in order to invest in them. If the company does well, its equities will increase in value. If it doesn't, its equities will fall in value. Read our full guide here for more info.
Bonds
Bonds are like IOUs between you and a company or government. You can lend them money by way of a loan and they pay you interest on this loan. This interest is called the bond 'yield' and the amount differs depending on how risky the loan is perceived to be - that is, how likely the borrower is to be unable to repay it. Bonds are usually considered to be lower risk investments and frequently feature in low and medium risk investment portfolios. You can read more about bonds here.
Risk Level/Category
Boring Money assigns each ready-made solution to a risk level/category based on its equity allocation. For the purpose of this exercise, there are three risk levels. Investments with an equity exposure of under 40% are considered low risk, investments with an equity exposure between 40% - 70% are considered medium risk, and investments with an equity exposure above 70% are considered high risk. You can read more about risk levels and how to determine which is right for you here.
Q3 2025
'3rd quarter'. The period between 1 July 2025 and 30 September 2025.
Net Growth
The total growth of a ready-made solution minus charges. Charges include both fees paid for managing the investment and fees paid for using the investment provider’s platform.
Boring Money selects one ready-made solution per provider for each risk category (see definition above). If a provider has more than one suitable ready-made option within a particular risk category, the option selected is the one with an equity allocation closest to a pre-determined exposure level, as shown below:
High risk - 100%
Medium risk - 60%
Low risk - 20%




Post a comment:
This is an open discussion and does not represent the views of Boring Money. We want our communities to be welcoming and helpful. Spam, personal attacks and offensive language will not be tolerated. Posts may be deleted and repeat offenders blocked at our discretion.
Your opinion matters
Be the first to comment.