Best-selling funds, Investment Trusts and ETFs of November 2024
Discover the most-bought investments across four major platforms
By Boring Money
13 Dec, 2024
Every month, Boring Money conducts rigorous research on what the best-selling investments were across the UK's major investment platforms - including AJ Bell, Fidelity, Hargreaves Lansdown and interactive investor. Scroll down for the full results and expert insights.
Boring Money's expert analysis
November was a significant month for global markets, with Donald Trump’s win in the US Presidential Election triggering repercussions felt around the world. US shares enjoyed strong gains, with the market consensus being that Trump’s policies will spur growth. The Federal Reserve also reduced interest rates by 0.25% - considered a good indication of economic health as lower rates often correlate with increased investment and consumption.
On the other hand, the outlook for emerging markets in the wake of Trump’s success was less positive, with investors concerned about the proposed imposition of punitive international trade tariffs. Many emerging markets saw outflows across the month, as institutional investors looked to park money elsewhere.
Closer to home, UK markets had a positive month, with the FTSE 100 recouping its losses from October, and the FTSE 250 gaining close to 2% across the month. The Bank of England also cut interest rates on November 13th, bringing the base rate down from 5% to 4.75%. Analysts are projecting further cuts in 2025.
Best-selling funds of November 2024
The most popular funds across multiple platforms including AJ Bell, Fidelity, Hargreaves Lansdown and interactive investor were Fidelity Index World and Legal & General Global Technology Index.
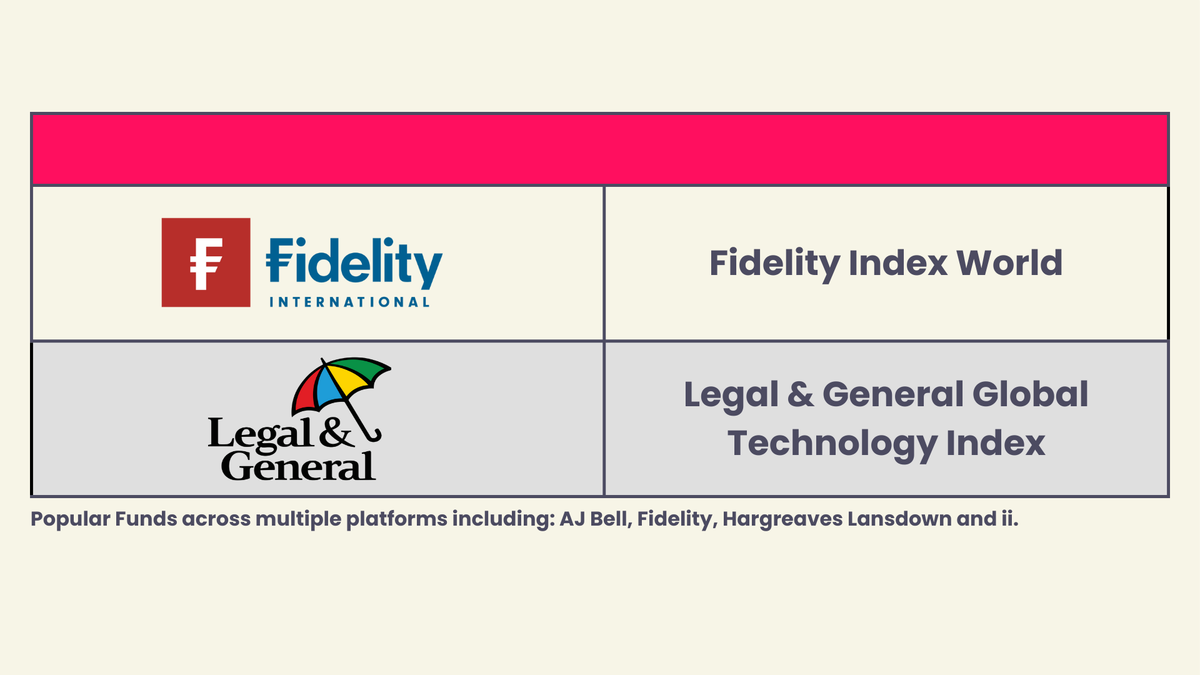
Fidelity Index World continues to be a popular choice for investors, adding to a 10-month streak of appearing on the best-selling list of all 4 platforms covered in this content series. With an ongoing charge of 0.12% and 5-year performance of 82%, it is easy to see why.
The fund provides low-cost access to global stock markets, consisting of over 1,400 companies from North America to Australasia. All 10 of the top holdings are US companies, and include the usual suspects of Nvidia, Google, and Microsoft, as well as Elon Musk's Tesla.
Elon has had a November to remember, enjoying Donald Trump's landslide win in the US election, before being tasked with leading the new Department of Government Efficiency. All whilst seeing a 38% rise in Tesla's stock price across the month, heavily increasing the value of the 700+ million shares he holds.
Legal and General's Global Technology Index was the other best-selling fund across all 4 platforms, and has a similar US tech-focused presence in its top holdings. However, unlike Fidelity Index World, L&G Global Technology takes large positions in its favoured stocks; The top 10 holdings alone make up 70% of all assets, with the remaining 244 holdings comprising just 30%. In fact, the top 4 stocks in this fund hold over 50% of its assets, with Apple, Nvidia, and Microsoft each having a weight of circa 15%.
Apple and Microsoft are up by a notable 30% and 20% respectively over 2024, however both of these stalwarts are dwarfed by Nvidia this year, which has seen stock price growth of 187% so far. In monetary terms, a £10,000 investment in Nvidia on January 1st would have grown to £28,700 today. Roll that back another 12 months to the beginning of 2023 and £10,000 invested in Nvidia then would be worth a whopping £94,400!
Hindsight is 20/20, but unfortunately we don't have a crystal ball in the real world. With all that being said, China launched an antitrust probe into Nvidia on 9th December, with share prices taking a hit as markets opened in the US. Nvidia’s current price of $137 also sits above Morningstar's fair value estimate of $130, with only a 3-star rating at the time of writing.
Best-selling funds from AJ Bell
Funds | 3 year performance | 5 year performance | Ongoing Charges Figure |
AJ Bell Adventurous | 23.91% | 49.14% | 0.31% |
AJ Bell Moderately Adventurous | 17.93% | 37.65% | 0.31% |
Fidelity Index World | 33.88% | 81.90% | 0.12% |
AJ Bell Balanced | 14.84% | 30.60% | 0.31% |
AJ Bell Global Growth | 17.93% | 46.85% | 0.31% |
Vanguard LifeStrategy 100% Equity | 28.44% | 62.82% | 0.22% |
HSBC FTSE All-World Index | 29.55% | 73.77% | 0.13% |
AJ Bell Responsible | 12.27% | N/A | 0.45% |
Legal & General Global Technology Index | 46.01% | 183.14% | 0.32% |
Vanguard FTSE Global All Cap Index | 28.46% | 70.95% | 0.23% |
Best-selling funds from Fidelity
Funds | 3 year performance | 5 year performance | Ongoing Charges Figure |
Fidelity Index World | 33.88% | 81.90% | 0.12% |
Fidelity Cash Fund | 11.05% | 11.27% | 0.15% |
Legal & General Global Technology Index | 46.01% | 183.14% | 0.32% |
Fidelity Index US Fund | 42.09% | 106.15% | 0.06% |
Fidelity Funds - Global Technology | 44.34% | 153.40% | 1.04% |
UBS S&P 500 Index | 42.77% | 108.26% | 0.09% |
Rathbone Global Opportunities | 11.98% | 79.91% | 0.51% |
Fidelity Global Dividend | 33.77% | 53.62% | 0.92% |
Royal London Short Term Money Market | 11.40% | 11.74% | 0.10% |
Legal & General Global Equity Index | 32.57% | 78.83% | 0.13% |
Best-selling funds from Hargreaves Lansdown
Funds | 3 year performance | 5 year performance | Ongoing Charges Figure |
HL Global Equity Income | N/A | N/A | 0.79% |
Legal & General US Index | 40.84% | 107.40% | 0.05% |
UBS S&P 500 Index | 42.32% | 107.60% | 0.09% |
Fidelity Index World | 33.88% | 81.90% | 0.12% |
Legal & General Global Technology Index | 46.47% | 184.70% | 0.20% |
Baillie Gifford American | -18.25% | 97.14% | 0.53% |
Legal & General International Index Trust | 32.94% | 82.01% | 0.08% |
HL Adventurous Managed | N/A | N/A | 0.96% |
Rathbone Global Opportunities | 11.98% | 79.91% | 0.51% |
Artemis US Smaller Companies | 22.08% | 77.99% | 0.87% |
Best-selling funds from interactive investor
Funds | 3 year performance | 5 year performance | Ongoing Charges Figure |
Vanguard LifeStrategy 80% Equity | 18.61% | 45.52% | 0.22% |
Royal London Short Term Money Market | 11.40% | 11.74% | 0.10% |
Legal & General Global Technology Index | 46.01% | 183.14% | 0.32% |
Vanguard US Equity Index | 38.77% | 102.78% | 0.10% |
Fidelity Index World | 33.88% | 81.90% | 0.12% |
HSBC FTSE All-World Index | 29.55% | 73.77% | 0.13% |
Vanguard LifeStrategy 100% Equity | 28.44% | 62.82% | 0.22% |
Vanguard FTSE Global All Cap Index | 28.46% | 70.95% | 0.23% |
Vanguard LifeStrategy 60% Equity | 9.48% | 29.67% | 0.22% |
Jupiter India | 78.29% | 126.87% | 0.99% |
Data provided by FE fundinfo, correct as at 30th November 2024
Best-selling Investment Trusts of November 2024

The most popular Investment Trusts across AJ Bell, Fidelity, Hargreaves Lansdown and interactive investor were F&C, JPMorgan Global Growth & Income, and Greencoat UK Wind.
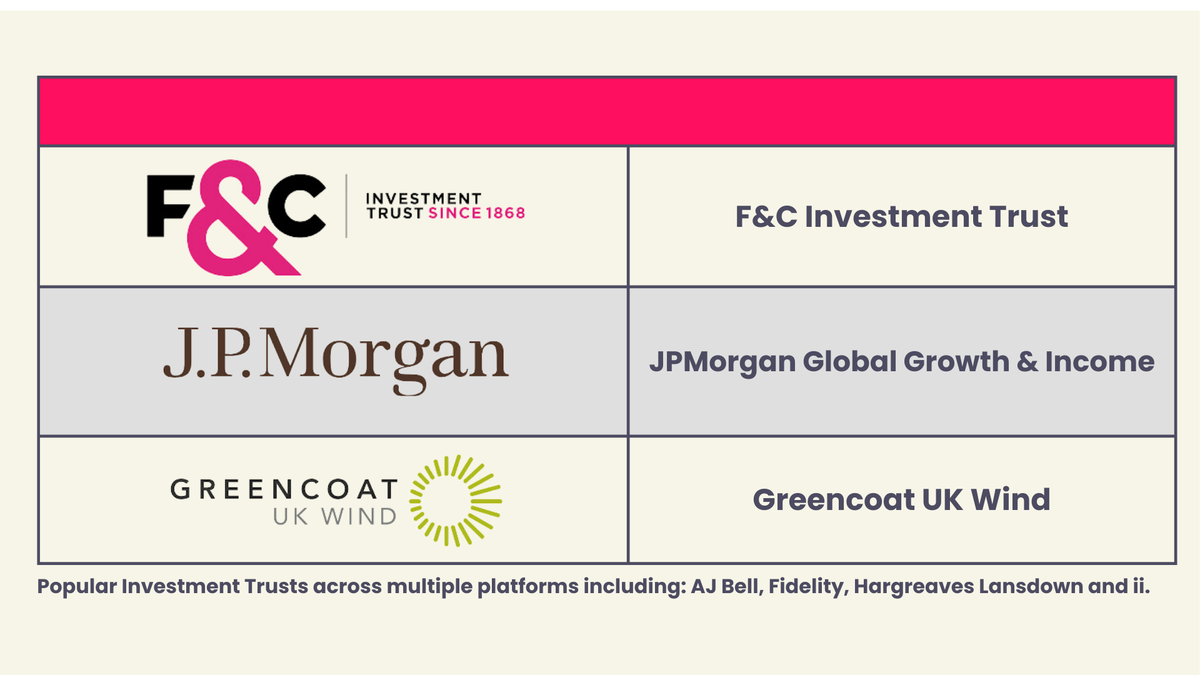
The world's oldest Investment Trust, F&C, was one of three trusts to appear on the best-selling list of all 4 platforms in November. The Trust has performed particularly well in recent months, returning 15% in the past 3 months and 28% across the past year. Longer-term performance has also been decent, with annualised growth of 11% across the last 5 years. However, this does lag the Trust's FTSE All World primary benchmark, which has returned 12.65% per year over the same period.
F&C's top 10 holdings broadly resemble many of the other funds in the market at the moment, including popular companies like Nvidia, Microsoft, Apple and Amazon. However, one of the more unique stock choices made by the Trust is Mastercard, which is up 24% YTD. Mastercard is the 2nd largest payment network in the world, only trailing behind Visa, and processed roughly $7 trillion in transactions during 2023.
According to Morningstar's research, Mastercard's global market share in credit and debit cards is estimated at 29% and 24% respectively. The current share price of circa $525 does sit above Morningstar's current fair value estimate of $465, although this valuation also sits on the lower side of analyst price targets.
Greencoat UK Wind is another popular choice at the moment, with November being the third successive month it has appeared in the best-selling list of 3 or more platforms. The Trust's price is down 10% over the last 3 months and it is now trading at a 20% discount to NAV (net asset value) - although estimating the true NAV of investments in the infrastructure category is particularly challenging, due to issues such as the reduced frequency of valuations leading to lags, as well as discrepancies in methodology between analysts in accurately valuing these real assets.
Best-selling Investment Trusts from AJ Bell
Investment Trusts | 3 year performance | 5 year performance | Ongoing Charges Figure |
F&C | 30.55% | 64.27% | 0.59% |
Scottish Mortgage | -35.75% | 82.15% | 0.35% |
JPMorgan Global Growth & Income | 50.10% | 110.36% | 0.53% |
Finsbury Growth & Income | 6.98% | 10.11% | 0.62% |
Merchants | 21.88% | 43.90% | 0.59% |
JPMorgan Emerging Markets | -9.73% | 14.85% | 0.90% |
Supermarket Income | -30.40% | -13.02% | 1.72% |
Murray International | 38.75% | 40.03% | 0.59% |
Greencoat UK Wind | 11.37% | 12.75% | 1.03% |
City of London | 30.01% | 28.94% | 0.37% |
Best-selling Investment Trusts from Fidelity
Investment Trusts | 3 year performance | 5 year performance | Ongoing Charges Figure |
Scottish Mortgage | -35.75% | 82.15% | 0.35% |
JPMorgan Global Growth & Income | 50.10% | 110.36% | 0.53% |
JPMorgan American | 60.03% | 151.93% | 0.38% |
Polar Capital Technology | 25.94% | 124.30% | 0.81% |
City of London | 30.01% | 28.94% | 0.37% |
Fidelity European | 17.64% | 55.51% | 0.77% |
Greencoat UK Wind | 11.37% | 12.75% | 1.03% |
Alliance Witan | 34.48% | 73.80% | 0.62% |
F&C | 30.55% | 64.27% | 0.59% |
Fidelity China Special Situations | -27.06% | 7.99% | 0.88% |
Best-selling Investment Trusts from Hargreaves Lansdown
Investment Trusts | 3 year performance | 5 year performance | Ongoing Charges Figure |
JPMorgan Global Growth & Income | 50.10% | 110.36% | 0.53% |
Greencoat UK Wind | 11.37% | 12.75% | 1.03% |
JPMorgan American | 60.03% | 151.93% | 0.38% |
JPMorgan US Smaller Companies | 18.04% | 59.15% | 1.09% |
Baillie Gifford US Growth | -19.58% | 96.02% | 0.70% |
Supermarket Income | -30.40% | -13.02% | 1.72% |
NextEnergy Solar Fund | -11.91% | -18.52% | 1.12% |
Polar Capital Technology | 25.94% | 124.30% | 0.81% |
Renewables Infrastructure | -18.24% | -8.68% | 0.88% |
F&C | 30.55% | 64.27% | 0.59% |
Best-selling Investment Trusts from interactive investor
Investment Trusts | 3 year performance | 5 year performance | Ongoing Charges Figure |
Greencoat UK Wind | 11.37% | 12.75% | 1.03% |
Scottish Mortgage | -35.75% | 82.15% | 0.35% |
JPMorgan Global Growth & Income | 50.10% | 110.36% | 0.53% |
Alliance Witan | 34.48% | 73.80% | 0.62% |
City of London | 30.01% | 28.94% | 0.37% |
F&C | 30.55% | 64.27% | 0.59% |
JPMorgan American | 60.03% | 151.93% | 0.38% |
NextEnergy Solar Fund | -11.91% | -18.52% | 1.12% |
3i Group | 196.41% | 311.78% | 1.30% |
Polar Capital Technology | 25.94% | 124.30% | 0.81% |
Data provided by FE fundinfo, correct as at 30th November 2024
Best-selling ETFs of November 2024
The most popular ETFs across AJ Bell, Fidelity, Hargreaves Lansdown and interactive investor were Vanguard S&P 500 Dist (VUSA), Vanguard S&P 500 Acc (VUAG), iShares Physical Gold (SGLN), Invesco NASDAQ 100 (EQQQ), and iShares Core S&P 500 (CSP1).
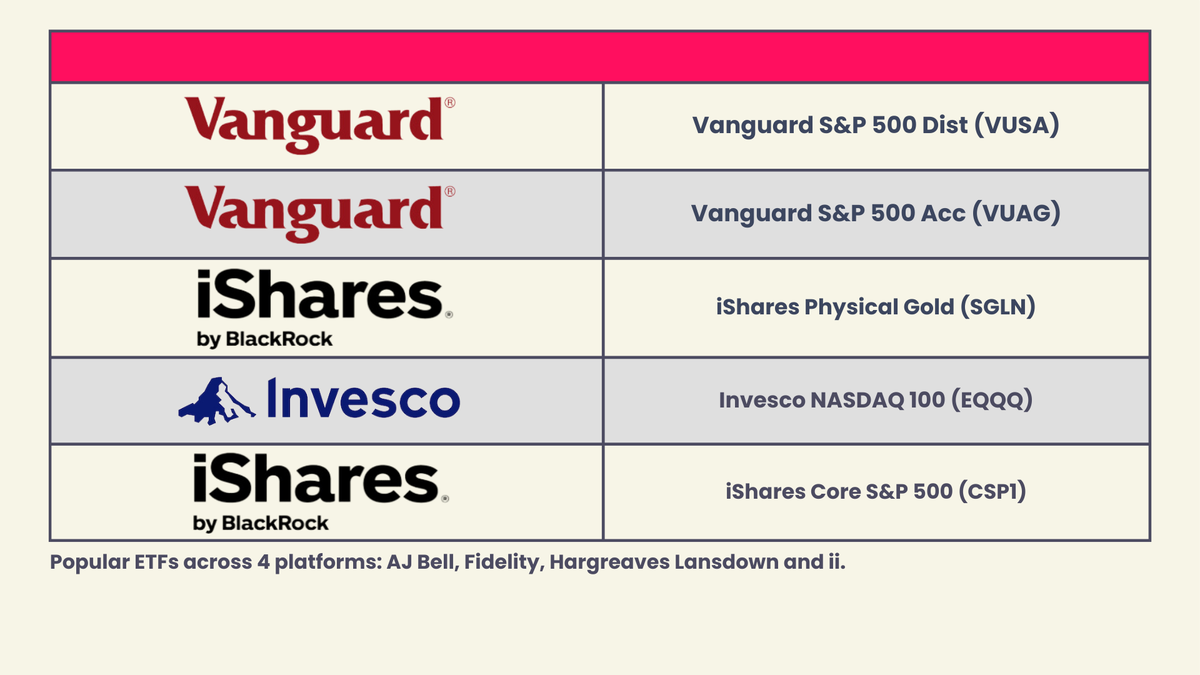
There are no surprises when looking at popular ETFs across all 4 major platforms, with S&P 500 trackers remaining popular, alongside the NASDAQ 100 and iShares Physical Gold. Vanguard's S&P 500 tracker is on track for its 5th double digit return in the past 6 years, and has returned over 25% in 2019, 2021, and 2024 so far. So it is no surprise to see investors continue to pour money into the US market.
One of the more unusual ETFs to make an appearance in the last month is VanEck's Crypto and Blockchain ETF, which was included in the best-selling list of 3 of the platforms covered. This ETF has had bumper returns of late, with 45% growth in November and 180% growth in the past 12 calendar months. Its largest holdings include MicroStrategy and the more well-known Coinbase.
MicroStrategy is having a particularly lucrative year in terms of stock price growth, as shares have rocketed by over 400% in 2024. Much of this rise is linked to an aggressive Bitcoin pursual strategy employed by the company, which has seen them spend over $25b on Bitcoin at an average price of roughly $60,000.
Bitcoin's price briefly ascended the $100k mark for the first time in early December 2024, and the coin is up 120% YTD, with MicroStrategy's current Bitcoin holdings amounting to over $40b, netting the firm a substantial profit. However, there are increasing concerns about the volatility of MicroStrategy's stock and whether the fortunes of the company could survive a Bitcoin price reversal. Despite this, MicroStrategy is showing no signs of slowing down, acquiring $2b of additional Bitcoin earlier this week at an average price of $98,783, highlighting their unyielding belief in the long-term potential of cryptocurrency.
Holders of MicroStrategy stock and the broader VanEck ETF need to brace themselves for a volatile ride; Whilst the ETF has returned over 80% in 2024 and 325% in 2023, it lost over 85% in 2022. Remember, a 50% drop is not equivalent to a 50% rise. A £100 stock that drops by 50% is worth £50. A 50% increase the following year would only take it back to £75. In reality, it actually requires 100% growth in the following year to get the £50 stock back to the break-even point of £100.
The point is, don't get lost in the numbers and make sure you invest in companies and funds where you believe in the underlying fundamentals of the instrument, and not just because of FOMO.
Best-selling ETFs from AJ Bell
ETFs | 3 year performance | 5 year performance | Ongoing Charges Figure |
Vanguard S&P 500 UCITS ETF GBP (VUSA) | 42.81% | 108.58% | 0.07% |
Vanguard S&P 500 UCITS ETF USD Acc (VUAG) | 42.81% | 108.58% | 0.07% |
iShares Core S&P 500 UCITS ETF USD (CSP1) | 42.81% | 108.55% | 0.07% |
iShares Physical Gold ETC (SGLN) | 52.38% | 83.49% | 0.12% |
VanEck Crypto & Blockchain Innovators ETF (DAGB) | N/A | N/A | 0.65% |
iShares Core FTSE 100 (ISF) | 31.04% | 34.61% | 0.07% |
Invesco NASDAQ 100 UCITS (EQQQ) | 36.77% | 158.74% | 0.30% |
Vanguard FTSE All-World UCITS ETF USD (VWRP) | 29.96% | 73.49% | 0.22% |
Vanguard FTSE All-World UCITS ETF (VWRL) | 29.96% | 73.49% | 0.22% |
HSBC MSCI World UCITS ETF (HMWO) | 34.12% | 83.85% | 0.15% |
Best-selling ETFs from Fidelity
ETFs | 3 year performance | 5 year performance | Ongoing Charges Figure |
Vanguard S&P 500 UCITS ETF USD Acc (VUAG) | 42.81% | 108.58% | 0.07% |
Vanguard S&P 500 UCITS ETF GBP (VUSA) | 42.81% | 108.58% | 0.07% |
iShares Core S&P 500 UCITS ETF USD (CSP1) | 42.81% | 108.55% | 0.07% |
Invesco NASDAQ 100 UCITS (EQQQ) | 36.77% | 158.74% | 0.30% |
iShares Physical Gold ETC (SGLN) | 52.38% | 83.49% | 0.12% |
iShares NASDAQ 100 UCITS ETF USD (CNX1) | 36.64% | 158.24% | 0.30% |
iShares S&P 500 Information Technology (IITU) | 64.05% | 209.04% | 0.15% |
SPDR Russell 2000 US Small Cap (R2SC) | 18.70% | 59.88% | 0.30% |
Invesco S&P 500 Equal Weight Index ETF (SPEX) | N/A | N/A | 0.20% |
Vanguard FTSE 100 (VUKE) | 31.01% | 34.44% | 0.09% |
Best-selling ETFs from Hargreaves Lansdown
ETFs | 3 year performance | 5 year performance | Ongoing Charges Figure |
Vanguard S&P 500 UCITS ETF USD Acc (VUAG) | 42.81% | 108.58% | 0.07% |
Vanguard S&P 500 UCITS ETF GBP (VUSA) | 42.81% | 108.58% | 0.07% |
VanEck Crypto & Blockchain Innovators ETF (DAGB) | N/A | N/A | 0.65% |
Vanguard FTSE All-World UCITS ETF USD (VWRP) | 29.96% | 73.49% | 0.22% |
Invesco NASDAQ 100 UCITS (EQQQ) | 36.77% | 158.74% | 0.30% |
iShares Physical Gold ETC (SGLN) | 52.38% | 83.49% | 0.12% |
iShares Core S&P 500 UCITS ETF USD (CSP1) | 42.81% | 108.55% | 0.07% |
iShares Core MSCI World (SWDA) | 34.32% | 83.31% | 0.20% |
Vanguard FTSE All-World UCITS ETF (VWRL) | 29.96% | 73.49% | 0.22% |
iShares S&P 500 Information Technology (IITU) | 64.05% | 209.04% | 0.15% |
Best-selling ETFs from interactive investor
ETFs | 3 year performance | 5 year performance | Ongoing Charges Figure |
Vanguard S&P 500 UCITS ETF GBP (VUSA) | 42.81% | 108.58% | 0.07% |
Vanguard S&P 500 UCITS ETF USD Acc (VUAG) | 42.81% | 108.58% | 0.07% |
iShares Physical Gold ETC (SGLN) | 52.38% | 83.49% | 0.12% |
iShares Core MSCI World (SWDA) | 34.32% | 83.31% | 0.20% |
Invesco NASDAQ 100 UCITS (EQQQ) | 36.77% | 158.74% | 0.30% |
VanEck Crypto & Blockchain Innovators ETF (DAGB) | N/A | N/A | 0.65% |
Vanguard FTSE All-World UCITS ETF (VWRL) | 29.96% | 73.49% | 0.22% |
iShares Core S&P 500 UCITS ETF USD (CSP1) | 42.81% | 108.55% | 0.07% |
Vanguard FTSE All-World UCITS ETF USD (VWRP) | 29.96% | 73.49% | 0.22% |
iShares Core FTSE 100 (ISF) | 31.04% | 34.61% | 0.07% |
Data provided by FE fundinfo, correct as at 30th November 2024


