



Top Performing ETFs, Funds, and Investment Trusts | May - July 2025
By Boring Money
14 Aug, 2025
At the start of April, The day the Trump administration unveiled its trade policy and tariffs created volatility across global stock markets. Markets tumbled as investors responded to the scale and breadth of tariffs. They also worried over the crude calculation used to calculate the tariffs, which imposed huge penalties on uninhabited islands or remote countries with a single export to the US.
However, markets have slowly adjusted to the new regime. They appear to have learned that Trump does not generally follow through on his wilder threats (the ‘TACO’ trade – ‘Trump always chickens out’), while subsequent trade deals and carve outs have calmed them. Overall, it was a strong quarter for Another word for shares or stocks., with a resurgent US leading the way. In particular, the technology sector has been strong after a weak first quarter, reviving investor faith in the ‘Magnificent Seven’ trade.
The other major crisis came from the Middle East. The US launched missile strikes on Iranian nuclear facilities on 23 June. There were worries that Iran would retaliate by disrupting the straits of Hormuz – an important shipping route – and the oil price briefly spiked higher. However, the fears were short-lived and the tension appeared to have subsided by the end of June.
Overall, technology emerged as the best-performing sector over the quarter, supported by a generally strong results season for major names such as Nvidia, Meta, Microsoft and Alphabet. There were some weak spots, however, with Apple and Tesla still struggling with the impact of tariffs.
Industrials were also strong, particularly those areas likely to be beneficiaries of renewed military spending in Europe. The aerospace and defence segment continued its strong run since the start of the year as renewed commitments started to come through on companies’ bottom line. The excitement around military spending even extended to the technology sector with companies such as Palantir performing extremely well.
Other areas of strength included energy and financials. Financials have been making hay in a climate of higher The amount that a lender charges someone for taking out a loan or a mortgage. It's calculated as a percentage of the amount borrowed - for example, 3%., with banks in particular posting strong gains. The ‘Big Beautiful Bill’, passed at the end of June, was welcomed by the American Bankers Association.[1] It paves the way for greater deregulation in the banking sector. In Europe, hopes of greater cross-border merger and acquisition activity have also supported the sector.
The energy sector has made progress in spite of lacklustre energy prices. It has been buoyed by expectations of higher demand from AI.
At the bottom of the heap has been the healthcare sector. Performance has been held back by fears over drug pricing. Donald Trump has made it clear that he intends to tackle high drug prices in the US compared to other countries. There has also been a lack of clarity on the likely tariffs for the pharmaceutical sector. A number of high profile healthcare companies have had idiosyncratic problems. Novo Nordisk, for example, has struggled with competitive threats on its flagship weightloss drug.
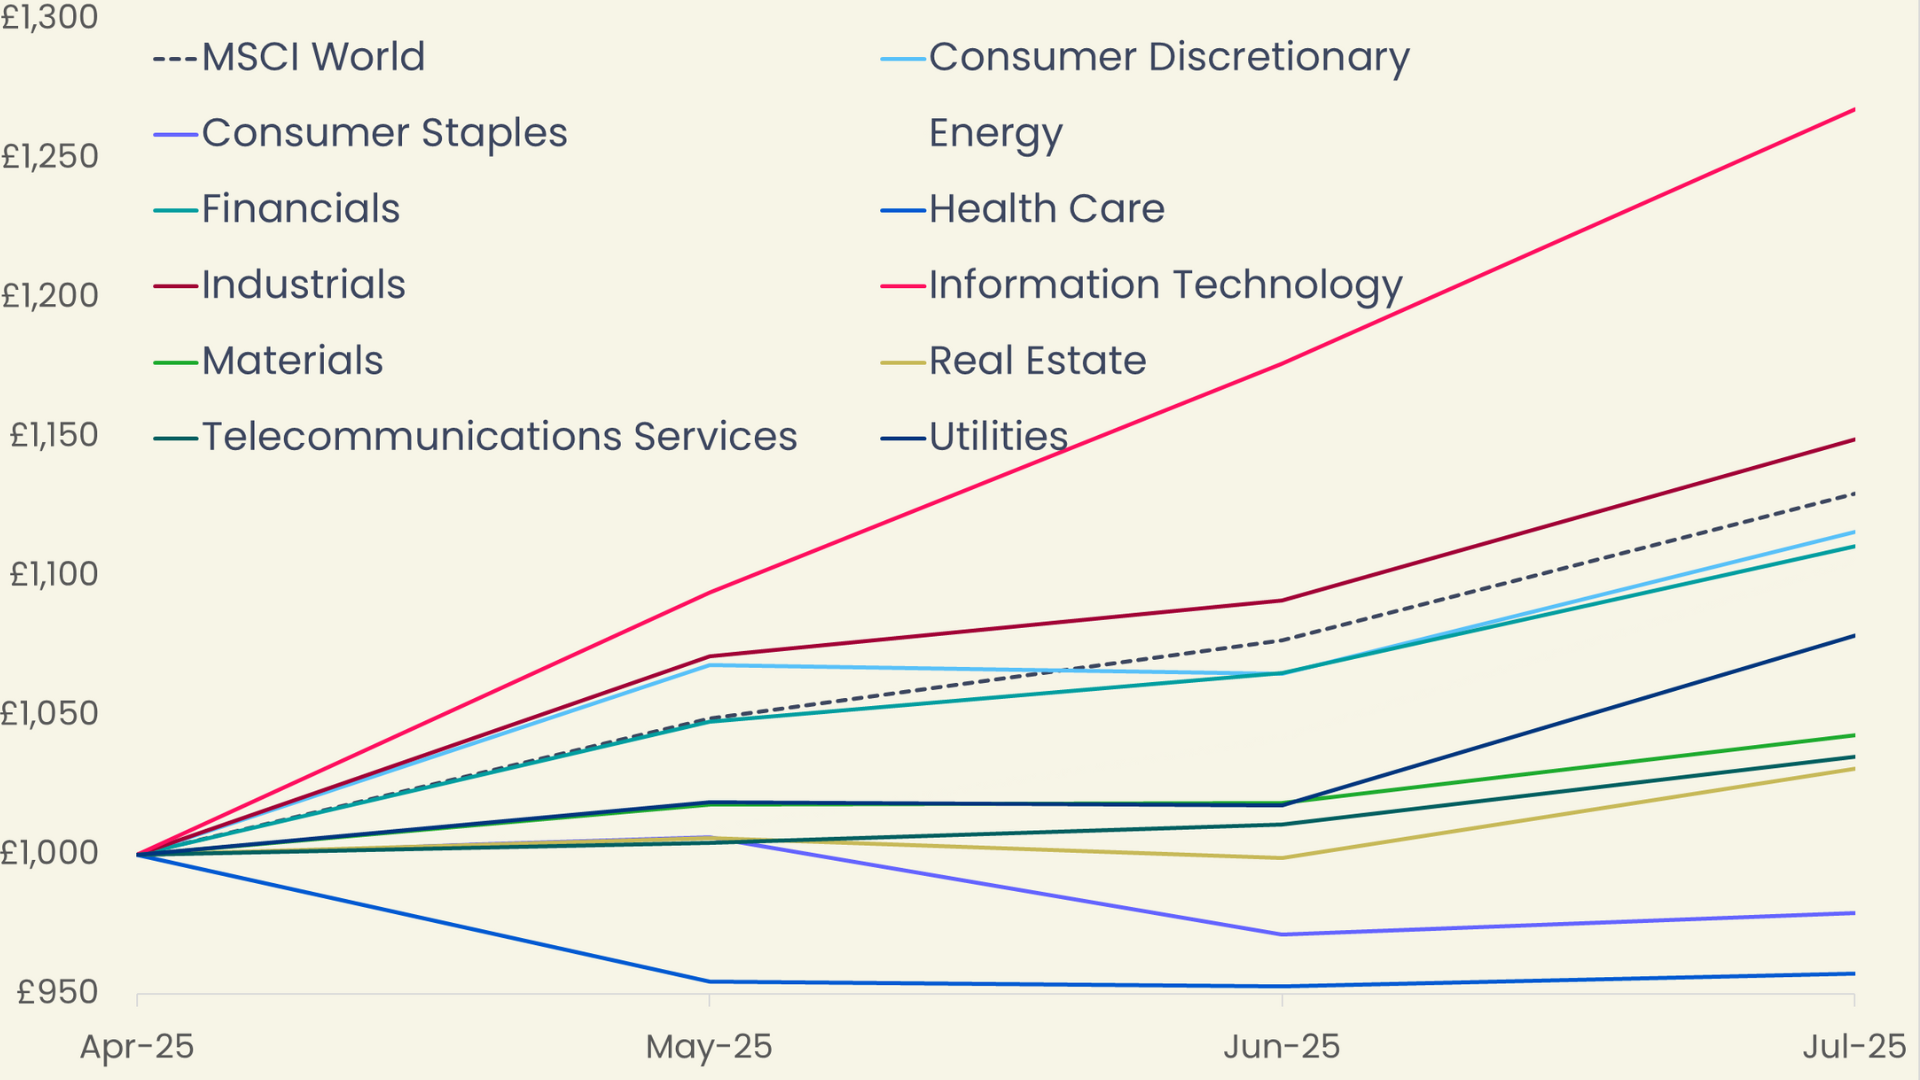
Sector performance vs MSCI World, May - July 2025
As investors look out to the remainder of 2025, there is growing concern over market complacency. Are investors pricing in the risks inherent in rising tariffs and shifting supply chains? Or the potential for a surge in US inflation? For the time being, markets appear to be priced for an optimistic outcome.
The table below illustrates the returns for a £1000 investment across May, June and July 2025.
Sector/Index | Initial Investment | Balance in May | Balance in June | Balance in July |
Information Technology | £1,000 | £1,094 | £1,176 | £1,268 |
Industrials | £1,000 | £1,071 | £1,091 | £1,149 |
MSCI World | £1,000 | £1,049 | £1,077 | £1,130 |
Consumer Discretionary | £1,000 | £1,068 | £1,065 | £1,116 |
Financials | £1,000 | £1,048 | £1,065 | £1,111 |
Energy | £1,000 | £1,009 | £1,042 | £1,106 |
Utilities | £1,000 | £1,019 | £1,018 | £1,079 |
Materials | £1,000 | £1,018 | £1,019 | £1,043 |
Telecommunications Services | £1,000 | £1,004 | £1,011 | £1,035 |
Real Estate | £1,000 | £1,006 | £999 | £1,031 |
Consumer Staples | £1,000 | £1,006 | £971 | £979 |
Health Care | £1,000 | £955 | £953 | £957 |
Data provided by FE FundInfo, correct as at 5th August 2025.
Top performing investments
Key observations
🌐 Technology staged a significant comeback, with a recovery of 9.43% in May, followed by 7.5% and 7.8% in June and July.
🏭 Industrials were supported by strength in the aerospace and defence sector, which had another strong quarter.
🛂 Some clarity on tariffs brought investors back to the US markets, while European equities were notably weaker. This was a significant reversal from the first quarter, when non-US markets were in the ascendancy.
⚕️ The healthcare sector was a notable weak spot, held back by concerns over drug pricing and problems at a number of the larger pharmaceutical groups.
🛍️ Consumer discretionary companies were building strength by the end of the quarter as fears over US economic weakness subsided.
Sector comparison
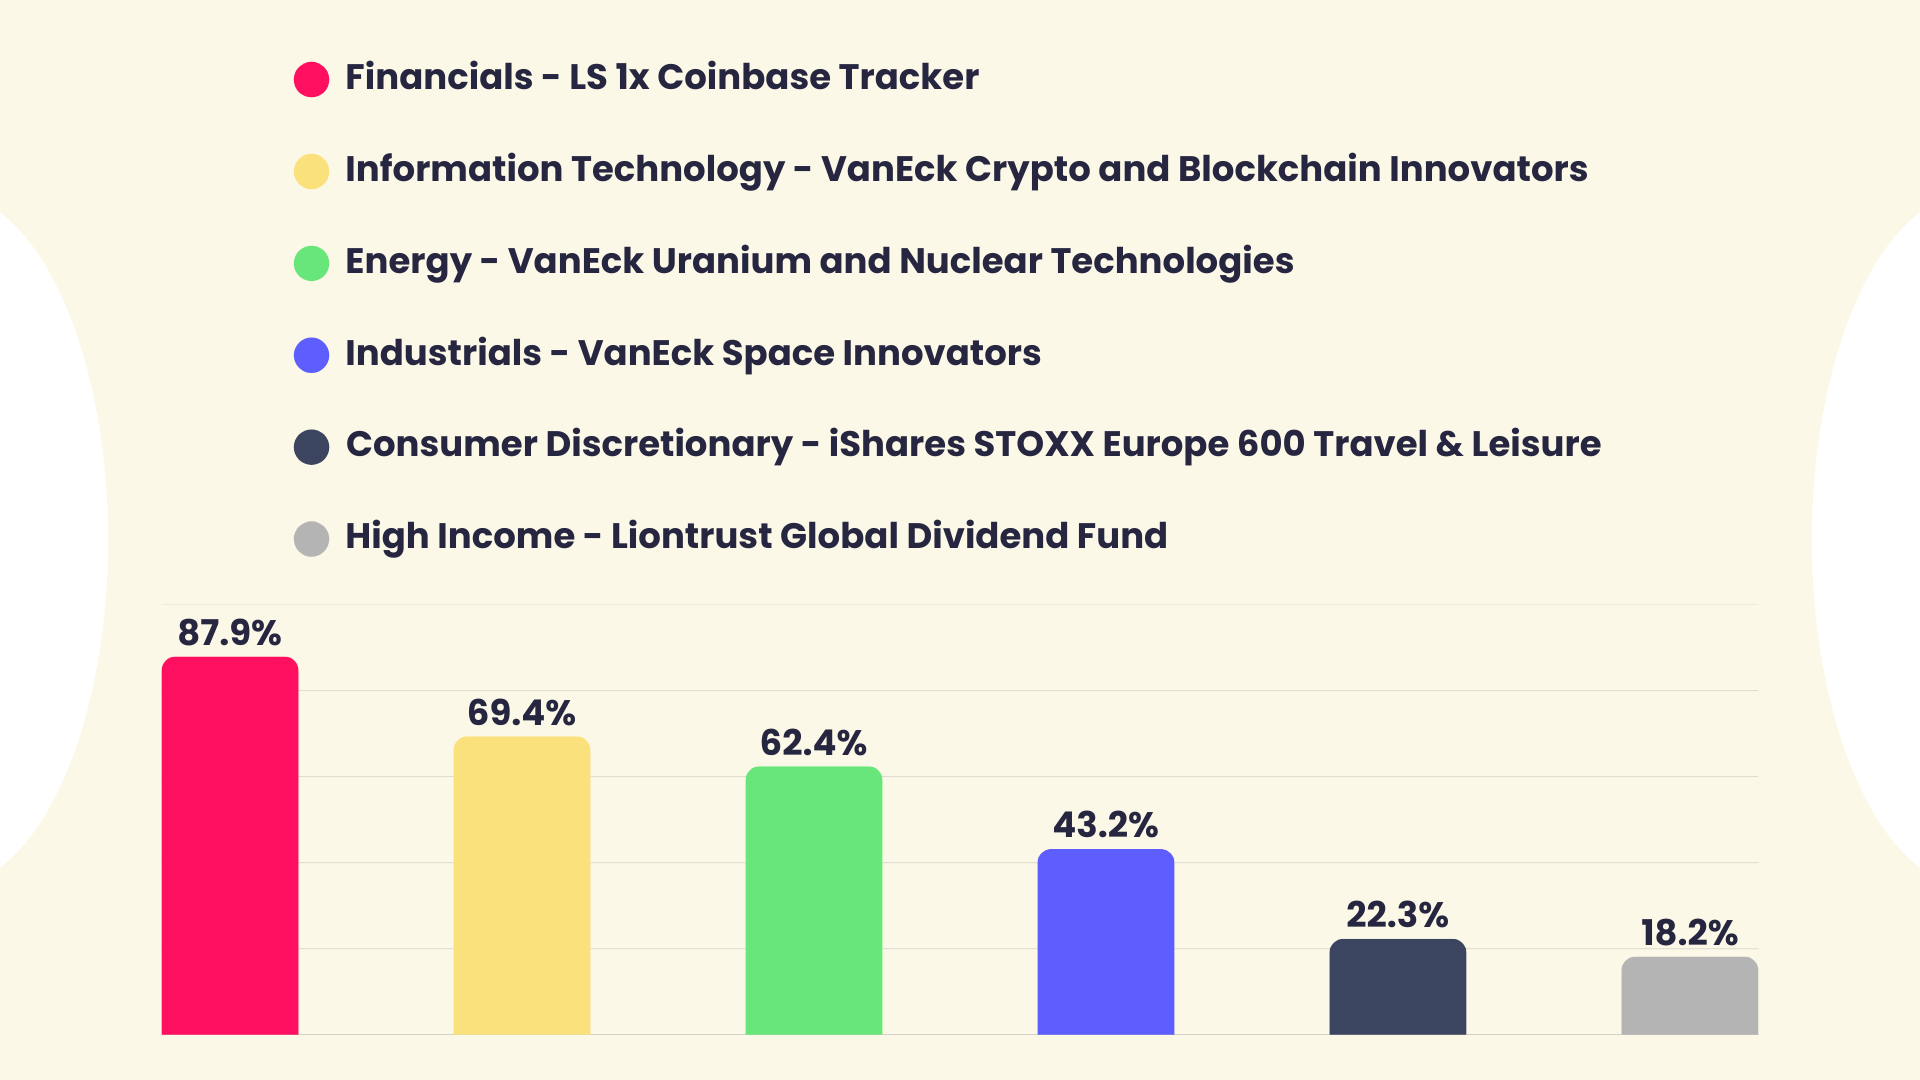
Top performers by sector
Category | Top Performer | Investment product | May - July Performance | 3-Year Performance | 5-Year Performance |
Financials | LS 1x Coinbase Tracker ETP (1COI) | ETF | 87.9% | 445.8% | N/A |
Information Technology | VanEck Crypto and Blockchain Innovators UCITS ETF (DAGB) | ETF | 69.4% | 153.2% | N/A |
Energy | VanEck Uranium and Nuclear Technologies UCITS ETF (NUCG) | ETF | 62.4% | N/A | N/A |
Industrials | VanEck Space Innovators UCITS ETF (JEDG) | ETF | 43.2% | 113.4% | N/A |
Consumer Discretionary | iShares STOXX Europe 600 Travel & Leisure UCITS ETF (EXV9) | ETF | 22.3% | 58.3% | 70.8% |
High Income | Liontrust Global Dividend Fund | Fund | 18.2% | 42.1% | 81.1% |
Data provided by FE FundInfo, correct as at 5 August 2025.


Polar Capital Technology Trust plc: Investing in the AI-era
By Ben Rogoff, Partner & Fund Manager
Artificial intelligence is reshaping industries and economies, creating extraordinary opportunities for investors. While we have seen volatility this year, this is a normal characteristic in the early stages of a new technology cycle and the technology sector has reasserted its leadership, driven by continued AI adoption and strong corporate earnings.
Looking to the future, the Polar Capital Technology team are excited by the potential for AI to create broader opportunities beyond the mega-cap technology stocks. Our experience spans multiple technology cycles, which should help us to navigate this broadening out and to embrace the opportunities being created by AI disruption.
It’s been an honour to be at the helm of the Polar Capital Technology Trust (PCT) for over 20 years. Now a FTSE 100 company, PCT remains at the forefront of technological transition, while the team has grown to be one of the largest technology investment teams in Europe. We continue to seek and invest in the real drivers and beneficiaries of AI adoption - carefully navigating powerful technologies while positioning for long-term growth.
This is a marketing communication. Capital at risk, the value of investments may go down as well as up.
Discover the power of discontinuous technology change with Polar Capital Technology Trust plc
Sector breakdown
🌐 Information Technology
Summary
After a difficult start to the year for the technology sector, it saw a significant revival in the second half. Certain areas performed particularly well. Notably, the VanEck Crypto and Blockchain Innovators UCITS ETF rose 69.4%. The environment for cryptocurrency has significantly improved under the new US administration, with regulations easing.
Name | Investment product | May - July Performance | 3-Year Performance | 5-Year Performance | OCF |
VanEck Crypto and Blockchain Innovators UCITS ETF (DAGB) | ETF | 69.4% | 153.2% | N/A | 0.65% |
Global X Blockchain UCITS ETF (BKCH) | ETF | 62.4% | 107.6% | N/A | 0.50% |
iShares Blockchain Technology UCITS ETF (BLKC) | ETF | 59.3% | N/A | N/A | 0.50% |
LS ARK NextGen Internet Tracker ETP (ARKB) | ETF | 54.8% | 163.7% | N/A | 1.22% |
WisdomTree Blockchain UCITS ETF (BKCN) | ETF | 47.7% | N/A | N/A | 0.45% |
Invesco CoinShares Global Blockchain UCITS ETF (BCHN) | ETF | 47.4% | 83.5% | 121.4% | 0.65% |
Amundi MSCI Semiconductors UCITS ETF (SEMG) | ETF | 43.4% | 169.0% | 220.5% | 0.35% |
Polar Capital Global Technology Fund | Fund | 41.4% | 96.0% | 102.2% | 1.11% |
Ark Artificial Intelligence & Robotics UCITS ETF (ARCI) | ETF | 41.0% | N/A | N/A | 0.75% |
Polar Capital Technology Trust (PCT) | Investment Trust | 39.3% | 87.9% | 106.2% | 0.77% |
Data provided by FE FundInfo, correct as at 5 August 2025.
The price of Bitcoin has soared over the quarter as investors have expected a more favourable regulatory regime for alternative asset classes. In August, it was announced that Trump was set to sign an executive order that would allow US retirement plans (401(k) accounts) to invest in Any asset or investment strategy outside of traditional stocks, bonds, and cash. For example, real estate, private equity, hedge funds, and commodities. , including Investments in companies that are not publicly traded (i.e. listed on a stock exchange). , real estate and Generally refers to assets created, bought, and sold in digital form, often on blockchain technology, with the potential for price appreciation or income generation. Examples include cryptocurrencies, digital tokens, NFTs, and tokenized securities. Bitcoin-focused ETFs have bounced in response.
While cryptocurrency ETFs dominated the league tables, generalised technology funds have also done well. The Polar Capital Global Technology Fund, for example, was up 41% over the quarter.
The AI trend is also firmly intact. Recent results from technology giants such as Meta, Alphabet and Microsoft showed that AI investment is paying off. The Ark Artificial Intelligence & Robotics UCITS ETF was a top performer over the quarter.
🏭 Industrials
Summary
The defence theme remained strong in the second quarter of 2025 as investors continued to bet that higher European commitments on defence would raise earnings for key companies in the sector. The majority of top performers in the Industrials sector played to this theme.
Name | Investment product | May - July Performance | 3-Year Performance | 5-Year Performance | OCF |
VanEck Space Innovators UCITS ETF (JEDG) | ETF | 43.2% | 113.4% | N/A | 0.55% |
Invesco Defence Innovation UCITS ETF Acc USD in GB | ETF | 26.3% | N/A | N/A | 0.35% |
Polar Capital Smart Mobility Fund | Fund | 24.2% | 3.6% | N/A | 0.99% |
iShares Global Aerospace & Defence UCITS ETF (DFND) | ETF | 23.1% | N/A | N/A | 0.35% |
First Trust Indxx Global Aerospace & Defence UCITS ETF (ICBM) | ETF | 21.8% | N/A | N/A | 0.65% |
Global X Defence Tech UCITS (ARMG) | ETF | 20.6% | N/A | N/A | 0.50% |
VanEck Defense UCITS ETF (DFNG) | ETF | 17.4% | N/A | N/A | 0.55% |
Invesco Industrials S&P US Select Sector UCITS ETF (XLIP) | ETF | 17.1% | 52.0% | 123.9% | 0.14% |
iShares S&P 500 Industrials Sector UCITS ETF (IISU) | ETF | 17.1% | 51.9% | 123.8% | 0.15% |
SSGA SPDR S&P U.S. Industrials Select Sector UCITS ETF (SXLI) | ETF | 17.1% | 51.9% | 123.7% | 0.15% |
Data provided by FE FundInfo, correct as at 5 August 2025.
The top performer was the VanEck Space Innovators UCITS ETF. While this may not sound like a defence-themed fund, it focuses on space exploration, rockets and propulsion systems, satellite equipment and communication solutions, all of which are important in modern defence. It rose 43.2% over three months.
Five of the 10 remaining top performing ETFs were defence funds, including the Invesco Defence Innovation UCITS ETF and iShares Global Aerospace & Defence UCITS ETF. While some Run by a professional or group of experts, usually called portfolio managers or fund managers, who make decisions about what to buy to try and outperform the market for their customers. managers had moved away from the theme, believing that the recent run in share prices had left the sector looking expensive, it has had more momentum than expected.
Defence budgets continue to grow and Europe is only in the early stages of making good on its spending commitments. However, share prices have run up a long way – particularly where defence and technology are combined. As a result, they may be due for a pause, even if the long-term outlook is compelling.
🛍️ Consumer Discretionary
Summary
Consumer discretionary ETFs have been weaker as fears over the impact of tariffs on the US economy have weighed on share prices. Multi-national consumer companies have been hard hit by the uncertainty on tariffs, and only started to recover in the latter part of July.
Name | Investment product | May - July Performance | 3-Year Performance | 5-Year Performance | OCF |
iShares STOXX Europe 600 Travel & Leisure UCITS ETF (DE) (EXV9) | ETF | 22.3% | 58.3% | 70.8% | 0.46% |
Global X Autonomous & Electric Vehicles UCITS ETF (DRVE) | ETF | 17.9% | -3.4% | N/A | 0.50% |
KraneShares Electric Vehicles & Future Mobility Screened UCITS ETF (KARP) | ETF | 16.0% | -40.6% | N/A | 0.72% |
Xtrackers MSCI USA Consumer Discretionary UCITS ETF 1D USD TR in GB | ETF | 15.2% | 34.3% | 70.9% | 0.12% |
SSGA SPDR S&P U.S. Consumer Discretionary Select Sector UCITS ETF (SXLY) | ETF | 15.2% | 35.4% | 78.2% | 0.15% |
iShares S&P 500 Consumer Discretionary Sector UCITS ETF (ICDU) | ETF | 14.7% | 33.4% | 66.1% | 0.15% |
Amedeo Air Four Plus (AA4) | ETF | 13.3% | 203.9% | 257.5% | 1.40% |
Invesco Consumer Discretionary S&P US Select Sector UCITS ETF (XLYP) | ETF | 12.7% | 33.5% | 75.6% | 0.14% |
Xtrackers MSCI World Consumer Discretionary UCITS ETF (XWDS) | ETF | 11.6% | 28.1% | 60.6% | 0.25% |
SSGA SPDR MSCI World Consumer Discretionary UCITS ETF (WCOD) | ETF | 11.6% | 28.0% | 60.4% | 0.30% |
Data provided by FE FundInfo, correct as at 5 August 2025.
The top performer was the iShares STOXX Europe 600 Travel & Leisure UCITS ETF, which is more focused on services companies and has therefore side-stepped the tariff impact. Generalised consumer discretionary ETFs also held up reasonably well over the quarter.
It was a far tougher time for areas such as carmakers. Volkswagen, for example, reported that it would take a €1.3bn hit from tariffs in its latest set of results.[2] There was some recovery in the electric car makers over the month, after a very difficult run of performance for companies such as Tesla.
Two of the top performers were focused on this part of the market - Global X Autonomous & Electric Vehicles UCITS ETF and KraneShares Electric Vehicles & Future Mobility Screened UCITS ETF. Even though the two ETFs are up 17.9% and 16.0% respectively over the past 3 months, they are still down 3.4% and 40.6% over three years.
💳 Financials
Summary
The financials sector continues to benefit from higher interest rates and rising earnings, but it is also seeing significant technological innovation. Areas such as payments are seeing multi-year transformation. This has created a strong backdrop for a number of the financial innovation funds and it was this part of the sector that did particularly well over the quarter.
Name | Investment product | May - July Performance | 3-Year Performance | 5-Year Performance | OCF |
LS 1x Coinbase Tracker ETP (1COI) | ETF | 87.9% | 445.8% | N/A | 0.15% |
Hansa Investment Company (HAN) | ETF | 26.4% | 53.0% | 75.2% | 1.11% |
Jupiter Financial Innovation Fund | Fund | 26.1% | 88.1% | 53.9% | 0.96% |
Jupiter Global Financial Innovation Fund | Fund | 25.5% | 87.9% | 53.5% | 1.00% |
Guinness Global Money Managers Fund | Fund | 24.9% | 48.2% | 106.9% | 0.74% |
Amundi Euro Stoxx Banks UCITS ETF (BNKE) | Fund | 23.1% | 234.4% | 358.1% | 0.30% |
iShares EURO STOXX Banks 30-15 UCITS ETF (DE) (0MLQ) | ETF | 22.9% | 230.4% | 351.9% | 0.51% |
Global X Fintech UCITS ETF (FINX) | ETF | 22.8% | 29.8% | N/A | 0.60% |
Invesco EURO STOXX Optimised Banks UCITS ETF (S7XP) | ETF | 22.6% | 230.5% | 343.6% | 0.30% |
Xtrackers MSCI USA Banks UCITS ETF (XUFB) | ETF | 21.4% | 60.2% | 144.0% | 0.12% |
Data provided by FE FundInfo, correct as at 5 August 2025.
Although the top performer was the LS 1x Coinbase Tracker ETP, which benefited from the strength of cryptocurrencies over the period, the Jupiter Financial Innovation and Jupiter Global Financial Innovation funds also delivered strong returns - up 26.1% and 25.5% respectively. The Global X Fintech UCITS ETF also had a strong quarter.
The banking sector continues to be a strong area for investors, particularly in Europe. The Amundi Euro Stoxx Banks UCITS ETF is up 234.4% over the past three years, having added 23.1% over the past three months. The iShares EURO STOXX Banks 30-15 UCITS ETF has been similarly strong.
Financial innovation is a multi-year trend and remains an exciting area.
Global fintech is on track for a rebound this year, with investment and M&A increasing after a challenging period. Rapid advancements in AI, automation and digital payments are transforming the financial industry.
The banking sector has just had another strong round of earnings, and there may still be strength in the rally.
🔋 Energy
Summary
The quarter saw a strong recovery for some parts of the energy market, in spite of lower oil and gas prices. The key theme among the top performers was their exposure to alternative energy companies. The top performing fund was the VanEck Uranium and Nuclear Technologies UCITS ETF, which rose 62.4%. Hydrogen-focused funds also did well, alongside solar and renewable energy infrastructure funds.
Name | Investment product | May - July Performance | 3-Year Performance | 5-Year Performance | OCF |
VanEck Uranium and Nuclear Technologies UCITS ETF (NUCG) | ETF | 62.4% | N/A | N/A | 0.55% |
WisdomTree Uranium And Nuclear Energy UCITS ETF (NCLP) | ETF | 59.0% | N/A | N/A | 0.45% |
Global X Hydrogen Fund | Fund | 55.0% | -63.7% | N/A | 0.50% |
HydrogenOne Capital Growth (HYDR) | ETF | 41.3% | -68.8% | N/A | 2.50% |
Geiger Counter (GCL) | ETF | 37.5% | 12.6% | 164.3% | 2.11% |
Kistos Holdings (KIST) | ETF | 35.7% | -67.6% | N/A | N/A |
Global Energy Infrastructure (ENRG) | ETF | 32.9% | -21.2% | N/A | 1.47% |
Premier Miton Global Renewables Trust PLC Ord 1P TR in GB | Investment Trust | 32.7% | -20.2% | 28.1% | 2.06% |
Invesco Solar Energy UCITS ETF (RAYS) | ETF | 30.5% | -60.1% | N/A | 0.69% |
Polar Capital Smart Energy Fund | Fund | 28.8% | 27.6% | N/A | 0.93% |
Data provided by FE FundInfo, correct as at 5 August 2025.
The VanEck Uranium and Nuclear Technologies UCITS ETF tracks the MarketVector Global Uranium and Nuclear Energy Infrastructure Index. Its top holdings include companies such as Cameco, Oklo and Nexgen Energy. The trust was launched in 2022 to take advantage of the growing need for alternative energy sources as the world decarbonises.
This part of the market has been weak in recent years: the pandemic created a boom in share prices, but the subsequent bust has been long and painful. There have also been worries over the future for alternative energy in the face of a US administration that is, at best, indifferent to climate change mitigation.
However, share prices in the sector had become extremely cheap. There has been some consolidation and investors are betting that renewable energy will be needed to meet the demands of artificial intelligence. Carbon emissions for many leading tech companies have been steadily on the rise and they are looking for solutions to reduce the environmental and financial cost of energy provision.
💷 High Income
Summary
Income stocks have been in higher demand in recent months, as a bulwark against uncertainty. The Liontrust Global Dividend fund was the top performer over the quarter, with a rise of 18.2%. Other areas of strength were Asia dividend stocks. These are often technology-focused and were lifted by stronger performance from the global technology sector. North American dividend funds also did well as US markets came back into favour.
Name | Investment product | May - July Performance | 3-Year Performance | 5-Year Performance | OCF |
Liontrust Global Dividend Fund | Fund | 18.2% | 42.1% | 81.1% | 0.87% |
MI Polen Capital Asia Income Fund | Fund | 16.3% | 28.2% | 50.1% | 1.22% |
Franklin US Dividend Tilt UCITS ETF (DIVU) | ETF | 16.2% | N/A | N/A | 0.12% |
Guinness Asian Equity Income Fund | Fund | 16.1% | 33.2% | N/A | 0.12% |
Schroder US Equity Income Maximiser Fund | Fund | 15.7% | 39.0% | 87.2% | 0.49% |
M&G North American Dividend Fund | Fund | 15.4% | 37.9% | 97.6% | 0.55% |
Schroder Asian Income Fund | Fund | 15.3% | 27.8% | 59.8% | 0.90% |
VT Tyndall Unconstrained UK Income Fund | Fund | 14.9% | 40.9% | 97.6% | 0.64% |
Global X SuperDividend UCITS ETF (SDIU) | ETF | 14.9% | 7.1% | N/A | 0.45% |
SSGA SPDR S&P Emerging Markets Dividend Aristocrats UCITS ETF (EMDV) | ETF | 14.4% | 33.2% | 55.7% | 0.55% |
Data provided by FE FundInfo, correct as at 5 August 2025.
The Liontrust Global Dividend fund focuses on innovative companies. Its top 10 includes Meta, Nvidia and Taiwan Semiconductor, which gives it a stronger ‘growth’ flavour than many other dividend funds. It was therefore a beneficiary of the rally in technology companies over the quarter.
Many of the leading global innovators that had been hardest hit during the April sell-off were among the first to see their share prices recover as broader sentiment improved.
The Guinness Asian Equity Income and Schroder Asian Income funds were also strong performers. Asian technology companies often pay higher dividends than their US, UK or European peers and therefore Asian income funds will often have a higher weighting in the sector. These funds also benefited from the relatively strong performance of Chinese markets over the quarter.
A final area of strength was, unexpectedly, the UK. Despite a difficult domestic economic picture, there was a surge in UK markets and the A company valued between £2 billion and £10 billion. Its shares sit between those of small‑cap (smaller companies) and large‑cap (big companies), usually offering a mix of growth potential and stability. in particular. This was good news for the VT Tyndall Unconstrained UK Income fund, which is focused on this part of the market and participated fully in the rebound.
📝 What this means for investors
In a nutshell
Performance data for May to July 2025 shows the resilience of the US markets and the technology sector in particular. In the first quarter, investors had started to question the strength of US equities in the face of unpredictable economic policy, a sliding Dollar, and weaker data. However, clarity over tariffs saw confidence return and both appear to have at last bounced back.
1) Recent momentum vs long-term trends
We saw a rotation back into the US after stronger performance from UK and European markets at the beginning of the year. However, the MSCI Europe ex UK index remains significantly ahead of the MSCI World for the year to date.[3] A weaker Dollar continues to weigh on European investors’ allocation to US markets and is likely to sustain the pattern of investors diversifying away from the US.
2) Sector rotation patterns
Technology resumed its dominance over the past 3 months, but there were signs of weakness at the margin. Among the technology giants, Apple, Tesla and Amazon all showed signs of weakness in their latest set of results and investors continue to fret over valuations. The defence sector continued to attract investment, though there were some signs of this slowing as valuations started to look extended. Financials and energy – particularly renewable energy – also saw strength. On the other hand, healthcare continued to look weak and is likely to remain volatile until there is greater clarity on drug pricing.
3) Risk-on vs risk-off sentiment
The past 3 months have been characterised by renewed market optimism and a re-embracing of higher risk growth assets. However, there are some concerns that markets are becoming complacent. The Columbia Threadneedle multi-asset team sums up the view of many market participants:
The consensus view in financial markets is that tariffs are on a deescalating path, but uncertainty remains high and there is a risk of complacency. Economic fundamentals are reasonable, and both companies and consumers have adjusted well to the ‘new normal’ interest rate environment… We continue to be ‘mildly positive’ on equities. We are, however, mindful that a lot of good news is priced in.
🔮 Looking forward
Based on the performance trends we've been discussing and current market outlook, investors might consider:
- Review your exposure to the US and the technology sector in particular. Indices remain highly concentrated in these two areas.
- Re-examine the healthcare sector. Valuations have dipped to low levels and the worst outcomes may be more than reflected in prices.
- Continue to look for compelling long-term themes away from artificial intelligence – financial innovation, for example, or cybersecurity.
- Consider how higher inflation could affect your portfolio if tariffs start to weigh on consumer prices and economic growth.
- Pay attention to Asian markets. If Donald Trump continues to defer tariffs on China, there could be further gains from the equities in the region.
📆 Upcoming events
- US inflation data – Investors will be looking to see whether tariff hikes start to show up in US inflation data, with a knock-on impact for US consumer confidence. Key dates are 11 September, 15 October and 13 November.
- US interest rate cuts – The Federal Reserve has held fast on interest rates, but weakening data may allow a rate cut in September. The key date expected is 17 September.
- US/China tariffs – The Chinese tariff deadline has been deferred once again. This is the final major deal to be agreed and has implications for global financial markets.
- Tariff agreements for specific sectors – This is particularly important for the healthcare sector, where greater clarity would allow better visibility on earnings.
---