Best-selling funds, investment trusts and ETFs of November 2023
Discover the most-bought investments across four major platforms
By Boring Money
13 Dec, 2023
Every month, Boring Money conducts rigorous research on what the best-selling investments were across the UK's major investment platforms - including AJ Bell, Fidelity, Hargreaves Lansdown and interactive investor. Scroll down for the full results and expert insights.
Boring Money's expert analysis
November was a great month for both equity and bond prices, with economic data and signs of increased consumer confidence pushing higher returns. Markets anticipate lower interest rates next year in response to slowing inflation, which is giving stock markets a boost. The S&P 500 returned over 9%, breaking a 3-month streak of declines, whilst UK and European markets also saw positive returns.
A closer look at returns in the States shows returns are largely being driven by a buoyant tech sector with a collection of shares known as the ‘Magnificent Seven’ doing most of the heavy lifting – these include Apple, Microsoft, Nvidia and Tesla. These 7 stocks now represent about 30% of the S&P 500 which is causing concentration risk concern amongst some professional investors.
Traders are increasing their bets on interest rate drops in the UK happening in the middle of 2024, with a small fall in GDP between September and October 2023 adding to the pressure on the BOE’s strong anti-inflation stance.


Best-selling funds of November 2023
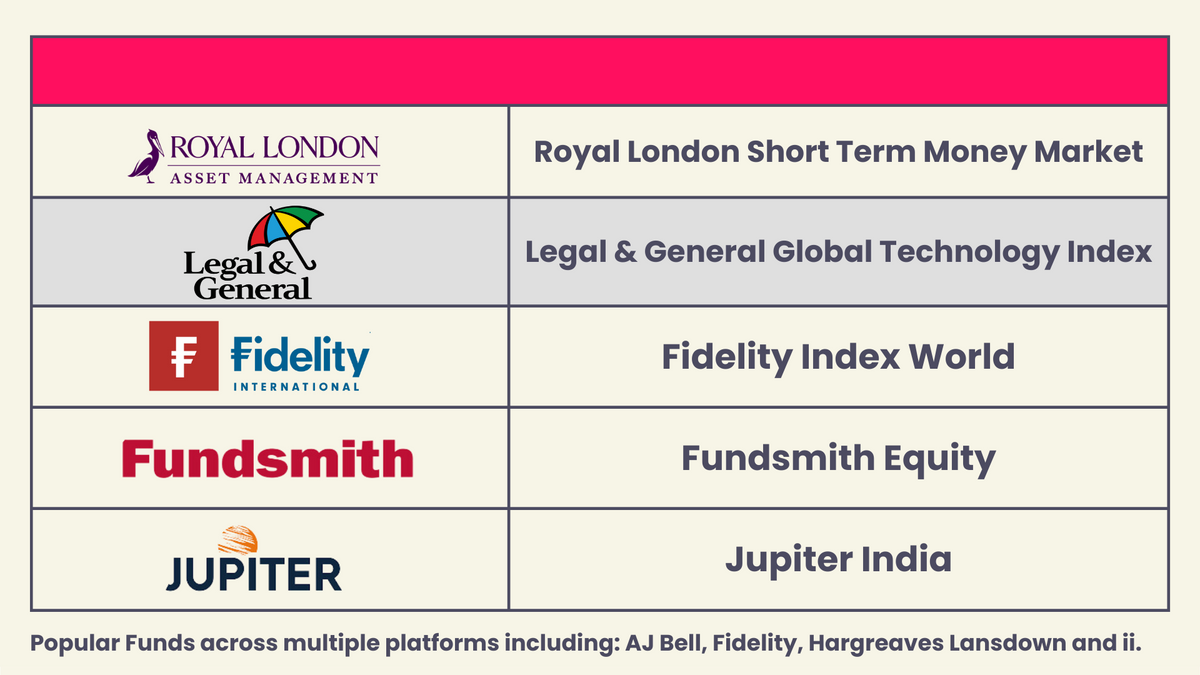
The five most popular funds across multiple platforms including AJ Bell, Fidelity, Hargreaves Lansdown and interactive investor were Royal London Short Term Money Market, Legal & General Global Technology Index, Fidelity Index World, Fundsmith Equity and Jupiter India.

The Jupiter India fund appeared in the bestselling list of multiple platforms in November, indicating that investors are looking for opportunity elsewhere in the world. Jupiter's flagship India fund has performed much better than its benchmark in recent years, with an annualised return of 22.1% over the past 3 years, compared to 13.3% for the Indian equity benchmark. So you can see why it’s grabbed attention. Looking over a longer time frame, performance continues to impress, with a £1,000 investment 10 years ago returning over £3,500 today.
The fund's current largest holdings are Godfrey Phillips India (7.7%), HCL Technologies (4.5%) and State Bank of India (4.1%). Godfrey Phillips are primarily tobacco manufacturers and distributors, and have more recently expanded into other areas like confectionery. The stock is up 24% in the past 6 months.
Investing in emerging markets like India however does often come with higher volatility in returns, which means that performance is more prone to flitting between good and bad, and the investment is susceptible to more risk factors than an investment in a completely developed market like the US.
Another thing to be conscious of when investing in foreign markets is currency risk. Many emerging markets can offer lucrative return potential, however these gains can be severely dampened by the foreign currency weakening against the Pound. For example, if a foreign investment makes 10%, but GBP strengthens by 10% against that foreign currency over the same time period, when the investor converts their investment back to pounds, they are left with an effective return of zero.
This concept can be seen in reality at the moment with Kenya. 10-year Kenyan government bonds are offering attractive yields around the 18% mark, but the Kenyan Shilling has depreciated by close to 23% against the GBP over the past 12 months. In essence, a UK investor in Kenyan bonds who wants to materialise their holdings would have made a loss in the past 12 months, despite earning 18% on their investment!

Best-selling funds from AJ Bell
Funds | 3 year performance | 5 year performance | Ongoing Charges Figure |
AJ Bell Adventurous | 21.54% | 44.84% | 0.31% |
AJ Bell Moderately Adventurous | 15.43% | 36.09% | 0.31% |
AJ Bell Global Growth | 19.69% | 44.16% | 0.31% |
Fidelity Index World | 29.35% | 63.71% | 0.12% |
AJ Bell Balanced | 11.08% | 31.38% | 0.31% |
Fundsmith Equity | 16.57% | 58.90% | 0.94% |
Vanguard LifeStrategy 100% Equity | 24.91% | 47.86% | 0.22% |
AJ Bell Responsible | 9.36% | N/A | 0.45% |
Vanguard FTSE Global All Cap | 23.07% | 52.69% | 0.23% |
Vanguard LifeStrategy 80% Equity | 14.58% | 35.53% | 0.22% |
Best-selling funds from Fidelity
Funds | 3 year performance | 5 year performance | Ongoing Charges Figure |
Fidelity Cash Fund | 5.43% | 6.45% | 0.15% |
Fidelity Index World | 29.35% | 63.71% | 0.12% |
Royal London Short Term Money Market | 5.76% | 6.88% | 0.10% |
Legal & General Global Technology Index | 49.19% | 165.06% | 0.32% |
Fidelity Funds - Global Technology | 45.62% | 155.38% | 1.04% |
Fidelity Index UK Fund | 25.82% | 26.77% | 0.06% |
Fundsmith Equity | 16.57% | 58.90% | 0.94% |
Fidelity Index US Fund | 37.98% | 79.97% | 0.06% |
abrdn Sterling Money Market | 5.63% | 6.96% | 0.15% |
Jupiter India | 92.78% | 73.01% | 0.99% |
Best-selling funds from Hargreaves Lansdown
Funds | 3 year performance | 5 year performance | Ongoing Charges Figure |
Royal London Short Term Money Market | 5.76% | 6.88% | 0.10% |
Legal & General Global Technology Index | 49.74% | 166.43% | 0.20% |
Jupiter India | 94.53% | 75.82% | 0.69% |
Fidelity Index World | 29.35% | 63.71% | 0.12% |
Legal & General International Index Trust | 28.72% | 63.45% | 0.08% |
UBS S&P 500 Index | 38.15% | 78.69% | 0.09% |
Legal & General Global 100 Index | 43.82% | 88.70% | 0.09% |
Legal & General US Index | 35.34% | 79.48% | 0.05% |
Legal & General All Stocks Gilt Index | -27.39% | -15.93% | 0.08% |
Artemis High Income | 2.58% | 12.55% | 0.74% |
Best-selling funds from interactive investor
Funds | 3 year performance | 5 year performance | Ongoing Charges Figure |
Royal London Short Term Money Market | 5.76% | 6.88% | 0.10% |
Fundsmith Equity | 16.57% | 58.90% | 0.94% |
Legal & General Global Technology Index | 49.19% | 165.06% | 0.32% |
Vanguard LifeStrategy 80% Equity | 14.58% | 35.53% | 0.22% |
Jupiter India | 92.78% | 73.01% | 0.99% |
HSBC FTSE All-World Index | 24.23% | 57.06% | 0.13% |
Vanguard LifeStrategy 100% Equity | 24.91% | 47.86% | 0.22% |
Vanguard US Equity Index | 32.16% | 72.12% | 0.10% |
Vanguard FTSE Dev World ex-UK Equity Index | 28.63% | 63.54% | 0.14% |
Vanguard FTSE Global All Cap | 23.07% | 52.69% | 0.23% |
Performance has been calculated in accordance with end-of-day market prices on 30/11/2023.
Best-selling investment trusts of November 2023
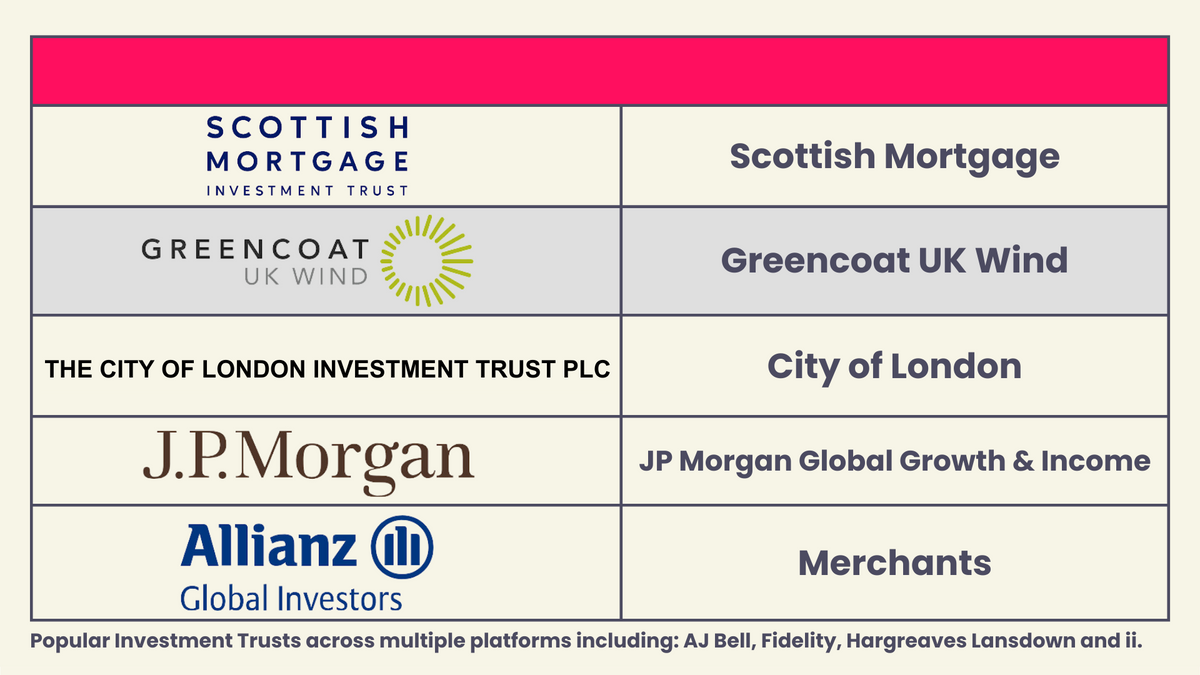
The five most popular investment trusts across AJ Bell, Fidelity, Hargreaves Lansdown and interactive investor were Scottish Mortgage, Greencoat UK Wind, City of London, JP Morgan Global Growth & Income and Merchants.

The Greencoat UK Wind Investment Trust looks to invest predominantly in UK wind farms with a capacity of over 10MW. On Monday 11th December, the Trust completed a 50% acquisition of Kype Muir Extension wind farm. This move results in Greencoat’s portfolio of wind farms increasing to 49 and gives the company a total generating capacity of over 2GW.
The Trust is trading at a 12.4% discount to its estimated NAV. Trading at a discount means that the cost of a share in an investment trust is lower than the estimated value of all things that make up that share. Logic says that’s a bargain! It could be – or it could also mean that investors feel the individual components that make up a share in the investment trust are overvalued, and the overall cost of a share in the investment trust is actually more reflective of the inherent value.
Best-selling investment trusts from AJ Bell
Investment Trusts | 3 year performance | 5 year performance | Ongoing Charges Figure |
Scottish Mortgage | -33.15% | 49.39% | 0.34% |
F&C | 23.21% | 38.88% | 0.59% |
Finsbury Growth & Income | 2.12% | 16.90% | 0.62% |
Greencoat UK Wind | 29.47% | 44.56% | 1.03% |
RIT Capital Partners | -4.82% | -4.07% | 2.08% |
JP Morgan Emerging Markets | -13.99% | 29.60% | 0.90% |
Merchants | 47.56% | 50.45% | 0.59% |
JP Morgan Global Growth & Income | 39.41% | 84.86% | 0.53% |
Henderson Far East Income | -16.48% | -10.93% | 1.09% |
Murray International | 34.23% | 45.61% | 0.59% |
Best-selling investment trusts from Fidelity
Investment Trusts | 3 year performance | 5 year performance | Ongoing Charges Figure |
Scottish Mortgage | -33.15% | 49.39% | 0.34% |
JP Morgan Global Growth & Income | 39.41% | 84.86% | 0.53% |
Edinburgh | 42.51% | 31.87% | 0.53% |
Murray International | 34.23% | 45.61% | 0.59% |
Fidelity European | 34.59% | 80.93% | 0.78% |
Fidelity Special Values | 24.06% | 22.01% | 0.70% |
City of London | 27.38% | 24.37% | 0.37% |
Fidelity China Special Situations | -39.92% | 17.48% | 1.18% |
Murray Income | 13.72% | 38.37% | 0.50% |
Dunedin Income Growth | 11.22% | 41.77% | 0.64% |
Best-selling investment trusts from Hargreaves Lansdown
Investment Trusts | 3 year performance | 5 year performance | Ongoing Charges Figure |
City of London | 27.38% | 24.37% | 0.37% |
Greencoat UK Wind | 29.47% | 44.56% | 1.03% |
Merchants | 47.56% | 50.45% | 0.59% |
HICL Infrastructure | -7.88% | 7.99% | 1.06% |
BlackRock World Mining | 42.71% | 123.02% | 0.99% |
Ashoka India Equity | 82.42% | 158.73% | 0.50% |
Gore Street Energy Storage | -1.31% | 20.25% | 1.31% |
Polar Capital Technology | 11.92% | 100.59% | 0.81% |
JLEN Environmental Assets Group | 0.32% | 20.80% | 1.24% |
The Renewables Infrastructure Group | 0.62% | 25.00% | 0.88% |
Best-selling investment trusts from interactive investor
Investment Trusts | 3 year performance | 5 year performance | Ongoing Charges Figure |
Scottish Mortgage | -33.15% | 49.39% | 0.34% |
Greencoat UK Wind | 29.47% | 44.56% | 1.03% |
City of London | 27.38% | 24.37% | 0.37% |
JP Morgan Global Growth & Income | 39.41% | 84.86% | 0.53% |
BlackRock World Mining | 42.71% | 123.02% | 0.99% |
India Capital Growth | 118.79% | 91.16% | 1.62% |
Alliance Trust | 27.76% | 58.26% | 0.64% |
Gore Street Energy Storage | -1.31% | 20.25% | 1.31% |
Henderson Far East Income | -16.48% | -10.93% | 1.09% |
Merchants | 47.56% | 50.45% | 0.59% |
Performance has been calculated in accordance with end-of-day market prices on 30/11/2023.
Best-selling ETFs of November 2023
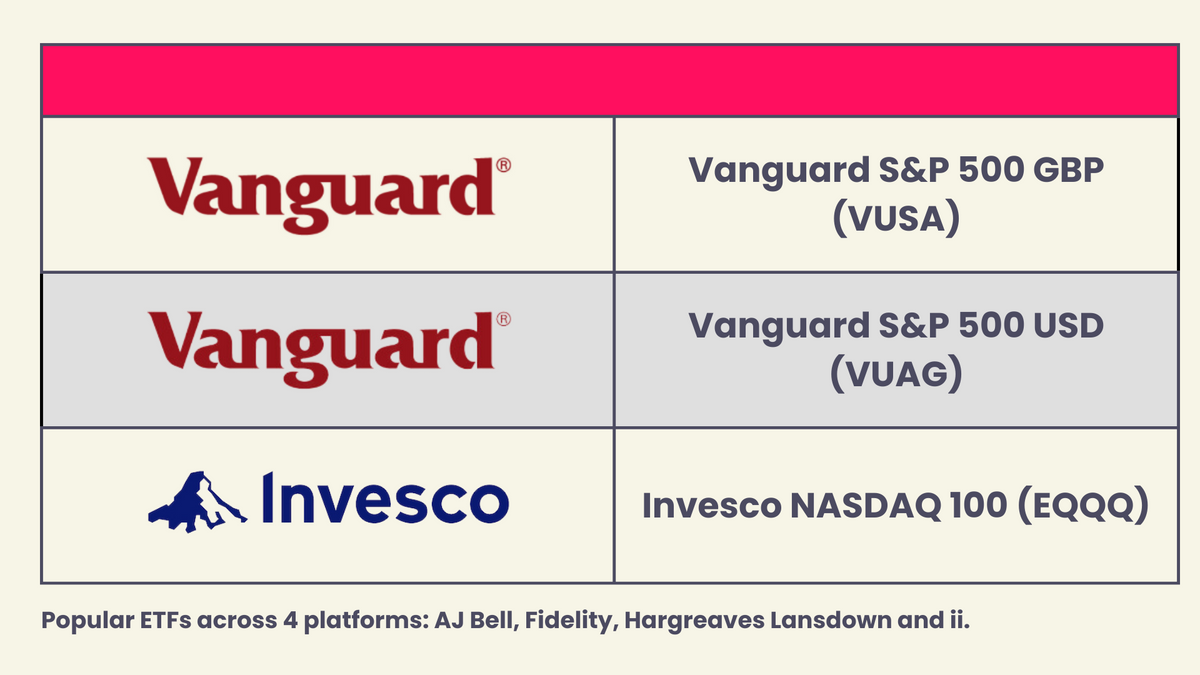
The three most popular ETFs across AJ Bell, Fidelity, Hargreaves Lansdown and interactive investor were Vanguard S&P 500 GBP (VUSA), Vanguard S&P 500 USD (VUAG) and Invesco NASDAQ 100 (EQQQ).

Vanguard's S&P 500 ETFs continue to be popular choices, with retail investors across different platforms purchasing both dollar and pound-denominated variations. The S&P 500 is viewed by many as a proxy for the US economy, and to a lesser extent, the world. In reality, the composition of the S&P 500 has fundamentally changed over the last decade, with mega-cap growth stocks like Amazon, Tesla, Meta, and Apple taking control over an increasingly larger proportion of this market-cap weighted index.
Invesco’s Nasdaq 100 was another popular option, and exposes investors to a higher percentage of the IT sector than the S&P 500 trackers. The Nasdaq returned a whopping 10.8% in November, with year-to-date performance reaching close to 50%.
Best-selling ETFs from AJ Bell
ETFs | 3 year performance | 5 year performance | Ongoing Charges Figure |
Vanguard S&P 500 UCITS ETF (VUSA) | 38.24% | 78.16% | 0.07% |
Vanguard S&P 500 UCITS ETF USD Acc (VUAG) | 38.24% | N/A | 0.07% |
iShares Core FTSE 100 (ISF) | 32.69% | 28.56% | 0.07% |
iShares Core S&P 500 UCITS ETF USD (CSP1) | 38.25% | 78.96% | 0.07% |
Vanguard FTSE All-World UCITS ETF (VWRL) | 24.58% | 55.36% | 0.22% |
HSBC MSCI World UCITS ETF (HMWO) | 30.14% | 64.04% | 0.15% |
iShares Physical Gold ETC (SGLN) | 21.31% | 67.11% | 0.12% |
iShares Core MSCI World (SWDA) | 29.70% | 62.75% | 0.20% |
Vanguard FTSE 250 UCITS (VMID) | 1.90% | 11.73% | 0.10% |
Invesco NASDAQ 100 UCITS (EQQQ) | 38.75% | 136.77% | 0.30% |
Best-selling ETFs from Fidelity
ETFs | 3 year performance | 5 year performance | Ongoing Charges Figure |
Vanguard S&P 500 UCITS ETF (VUSA) | 38.24% | 78.16% | 0.07% |
Vanguard FTSE 100 (VUKE) | 32.68% | 28.39% | 0.09% |
iShares S&P 500 Information Technology (IITU) | 61.75% | 185.83% | 0.15% |
Invesco NASDAQ 100 UCITS (EQQQ) | 38.75% | 136.77% | 0.30% |
Vanguard S&P 500 UCITS ETF USD Acc (VUAG) | 38.24% | N/A | 0.07% |
iShares Core UK Gilts UCITS ETF (IGLT) | -27.82% | -16.15% | 0.07% |
iShares Core S&P 500 UCITS ETF USD (CSP1) | 38.25% | 78.96% | 0.07% |
iShares Core FTSE 100 (ISF) | 32.69% | 28.56% | 0.07% |
SSGA SPDR® Bloomberg 15+ Year Gilt UCITS ETF (GLTL) | -47.39% | -31.96% | 0.15% |
iShares NASDAQ 100 UCITS ETF USD (CNX1) | 38.62% | 136.30% | 0.33% |
Best-selling ETFs from Hargreaves Lansdown (in alphabetical order)
ETFs | 3 year performance | 5 year performance | Ongoing Charges Figure |
Invesco NASDAQ 100 UCITS (EQQQ) | 38.75% | 136.77% | 0.30% |
Invesco S&P 500 UCITS GBP (SPXP) | 39.15% | 81.04% | 0.05% |
iShares MSCI ACWI UCITS ETF (SSAC) | 25.10% | 55.18% | 0.20% |
iShares S&P 500 Information Technology (IITU) | 61.75% | 185.83% | 0.15% |
Lyxor Smart Cash (CSH2) | 6.04% | 7.29% | 0.07% |
Vanguard FTSE All-World UCITS ETF USD (VWRP) | 24.58% | N/A | 0.22% |
Vanguard S&P 500 UCITS ETF USD Acc (VUAG) | 38.24% | N/A | 0.07% |
Vanguard S&P 500 UCITS ETF GBP (VUSA) | 38.24% | 78.16% | 0.07% |
WisdomTree NASDAQ 100 3x Daily Short (LQQS) | -80.22% | -98.72% | 1.60% |
WisdomTree S&P 500 VIX Short-Term Futures 2.25x Daily Lev (VILX) | -99.97% | -100.00% | 4.47% |
Best-selling ETFs from interactive investor
ETFs | 3 year performance | 5 year performance | Ongoing Charges Figure |
Vanguard S&P 500 UCITS ETF (VUSA) | 38.24% | 78.16% | 0.07% |
iShares Core MSCI World (SWDA) | 29.70% | 62.75% | 0.20% |
Vanguard S&P 500 (VUAG) | 38.24% | N/A | 0.07% |
iShares Core FTSE 100 (ISF) | 32.69% | 28.56% | 0.07% |
WisdomTree FTSE 100 3x Daily Leveraged (3UKL) | 65.41% | 1.32% | 2.15% |
Vanguard FTSE All-World UCITS ETF (VWRL) | 24.58% | 55.36% | 0.22% |
Invesco NASDAQ 100 UCITS (EQQQ) | 38.75% | 136.77% | 0.30% |
Lyxor Smart Overnight Return ETF (CSH2) | 6.04% | 7.29% | 0.07% |
Vanguard FTSE 100 (VUKE) | 32.68% | 28.39% | 0.09% |
iShares Physical Gold ETC (SGLN) | 21.31% | 67.11% | 0.12% |
Performance has been calculated in accordance with end-of-day market prices on 30/11/2023.