Best-selling funds, investment trusts and ETFs of October 2023
Discover the most-bought investments across four major platforms
By Boring Money
10 Nov, 2023
Every month, Boring Money conducts rigorous research on what the best-selling investments were across the UK's major investment platforms - including AJ Bell, Fidelity, Hargreaves Lansdown and interactive investor. Scroll down for the full results and expert insights.
Boring Money's expert analysis
We can take a sneak peek back at October and quickly build a picture of what retail investors are up to. I can loosely summarise the ‘wisdom of the crowds’ as this:
1. Money market funds – cash-like investments which pay around 5% a year at the moment with very minimal risk. Safe, boring, and cheap. (I think ‘boring’ can sometimes be a compliment, btw!).
What job are they doing for us? Cash-like things we can hold in the tax quarantine of an ISA and a pension, avoiding the tax on the ‘interest’ we earn here.
2. Global tracker funds – low-cost pre-packaged parcels of investments which give us access to 1000s of international shares in one ready-made bundle. We’re not trying to be smart and pick the winners – we’re just in the game that is global capitalism.
What job are they doing for us? Cheap access to a belief that in general, large global firms will still make money and gawd knows precisely which ones will be the winners, so just buy lots and spread your bets. These are pretty mainstream, sensible options for those who don’t like the agony of choice!
3. Jupiter India – access to major Indian firms and a cherry-picked circa 70 Indian companies. I share the disclaimer that India is my investment nemesis. I always call it wrong because I want to believe in the growth fundamentals of this country I love and have marveled at for years. And sometimes I’m not patient enough for these long-term trends. But I did top up some holdings in this fund a few months ago. Up 17% over the last 12 months, you can see why it’s attracting interest... but this should never be more than a ‘side dish’ on your investing menu.
What job is it doing for us? Something spicy at a time when many regions feel at the mercy of geo-political tension. As I’ve said, I’m a sucker for the business case for India, with its young, vibrant population. The question is around the timeframes.
Have a read below for more information on what is popular with investors right now. If you’re a more confident investor, and you fancy picking a few sectors or regions, you may find the investment trust bestsellers more interesting, as they tend to be more focused and attract a savvier investor.


Best-selling funds of October 2023
The three most popular funds across multiple platforms including AJ Bell, Fidelity, Hargreaves Lansdown and interactive investor were Royal London Short Term Money Market, Fundsmith Equity and Fidelity Index World.

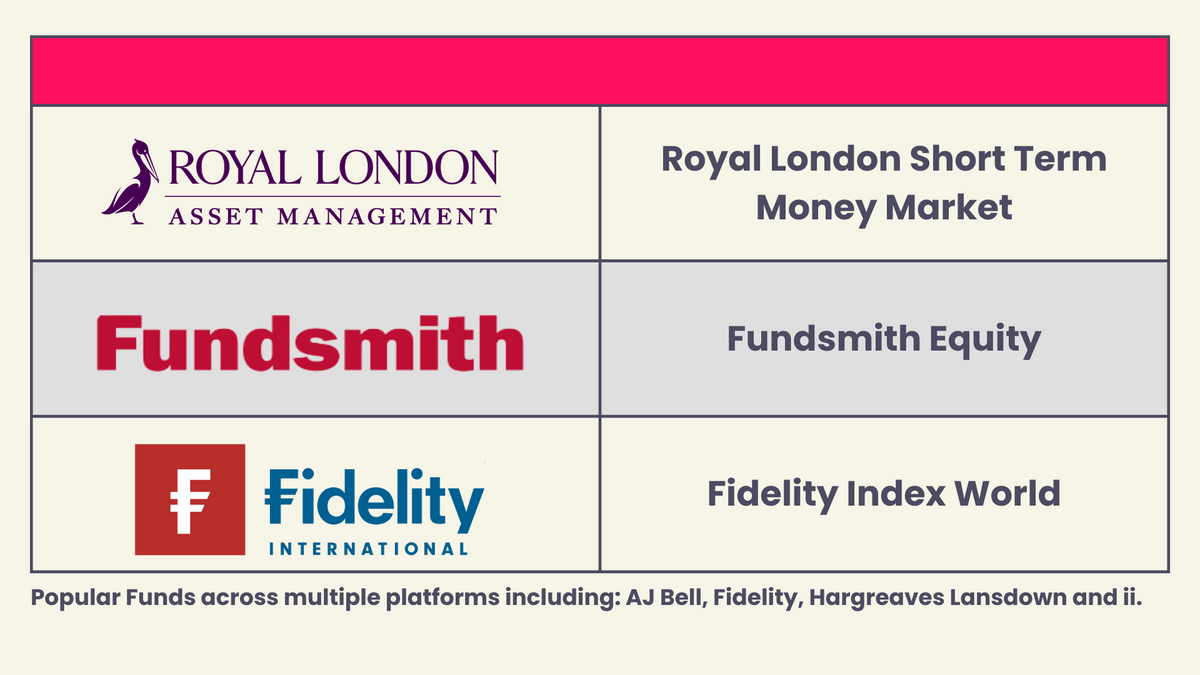
The popular Fundsmith Equity appeared in three out of four of the bestselling lists of of the major platforms we cover. The fund is well-known for investing in a small number of companies (generally 29-30) that they believe are high quality, resilient, and providing good value. Fundsmith Equity started their fund in 2010 and have achieved an impressive average year-on-year return of 14.8%, with 68% of the months between now and inception being months of positive performance.
In October, the fund opened a position in Fortinet, which is a cybersecurity company with headquarters in California. The Fortinet stock is down 16% in the past month, however over a longer 5-year period, has returned 250%.
Top contributors to Fundsmith's performance in October include Microsoft and Nike, with both companies returning over 7% across the month. If we look across all of 2023 however, the two companies have had different fortunes, with Microsoft up a massive 51% YTD and Nike down 13% YTD.

Best-selling funds from AJ Bell
Funds | 3 year performance | 5 year performance | Ongoing Charges Figure |
AJ Bell Adventurous | 28.22% | 39.84% | 0.31% |
AJ Bell Moderately Adventurous | 20.56% | 31.04% | 0.31% |
AJ Bell Global Growth | 27.26% | 40.55% | 0.31% |
AJ Bell Balanced | 14.45% | 26.59% | 0.31% |
Fidelity Index World | 34.34% | 57.16% | 0.12% |
Fundsmith Equity | 17.67% | 57.97% | 0.94% |
AJ Bell Responsible | N/A | N/A | 0.45% |
Vanguard LifeStrategy 100% Equity | 31.35% | 43.14% | 0.22% |
Vanguard FTSE Global All Cap | 28.35% | 48.20% | 0.23% |
Vanguard LifeStrategy 80% Equity | 18.63% | 31.03% | 0.22% |
Best-selling funds from Fidelity
Funds | 3 year performance | 5 year performance | Ongoing Charges Figure |
Fidelity Index World | 34.34% | 57.16% | 0.12% |
Fidelity Cash Fund | 4.96% | 6.04% | 0.15% |
Royal London Short Term Money Market | 5.29% | 6.47% | 0.10% |
Legal & General Cash Trust Inc | 5.03% | 6.08% | 0.15% |
Legal & General European Index Trust | 31.76% | 38.93% | 0.12% |
Legal & General Global Technology Index | 47.03% | 135.06% | 0.32% |
Fundsmith Equity | 17.67% | 57.97% | 0.94% |
Fidelity Funds - Global Technology | 49.39% | 138.03% | 1.04% |
Fidelity Index US Fund | 40.57% | 73.42% | 0.06% |
Legal & General Cash Trust Acc | 5.02% | 6.07% | 0.15% |
Best-selling funds from Hargreaves Lansdown
Funds | 3 year performance | 5 year performance | Ongoing Charges Figure |
Royal London Short Term Money Market | 5.29% | 6.47% | 0.10% |
Fidelity Index World | 34.34% | 57.16% | 0.12% |
Jupiter India | 99.52% | 82.98% | 0.69% |
Legal & General Cash Trust | 5.02% | 6.07% | 0.15% |
Fidelity Cash Fund | 4.96% | 6.04% | 0.15% |
abrdn Sterling Money Market | 5.16% | 6.52% | 0.15% |
Premier Miton UK Money Market | 5.38% | 6.55% | 0.26% |
Legal & General US Index | 40.07% | 72.16% | 0.05% |
UBS S&P 500 Index | 41.93% | 74.50% | 0.09% |
Legal & General International Index Trust | 34.86% | 56.74% | 0.08% |
Best-selling funds from interactive investor
Funds | 3 year performance | 5 year performance | Ongoing Charges Figure |
Royal London Short Term Money Market | 5.29% | 6.47% | 0.10% |
Fundsmith Equity | 17.67% | 57.97% | 0.94% |
Vanguard LifeStrategy 80% Equity | 18.63% | 31.03% | 0.22% |
Vanguard LifeStrategy 100% Equity | 31.35% | 43.14% | 0.22% |
HSBC FTSE All-World Index | 28.75% | 52.33% | 0.13% |
Jupiter India | 97.73% | 80.05% | 0.99% |
Vanguard FTSE Global All Cap | 28.35% | 48.20% | 0.23% |
Legal & General Global Technology Index | 47.03% | 135.06% | 0.32% |
Vanguard US Equity Index | 36.98% | 67.64% | 0.10% |
Vanguard FTSE Dev World ex-UK Equity Index | 33.78% | 58.11% | 0.14% |
Performance has been calculated in accordance with end-of-day market prices on 31/10/2023.
Best-selling investment trusts of October 2023
The two most popular investment trusts across AJ Bell, Fidelity, Hargreaves Lansdown and interactive investor were JP Morgan Global Growth & Income and City of London.

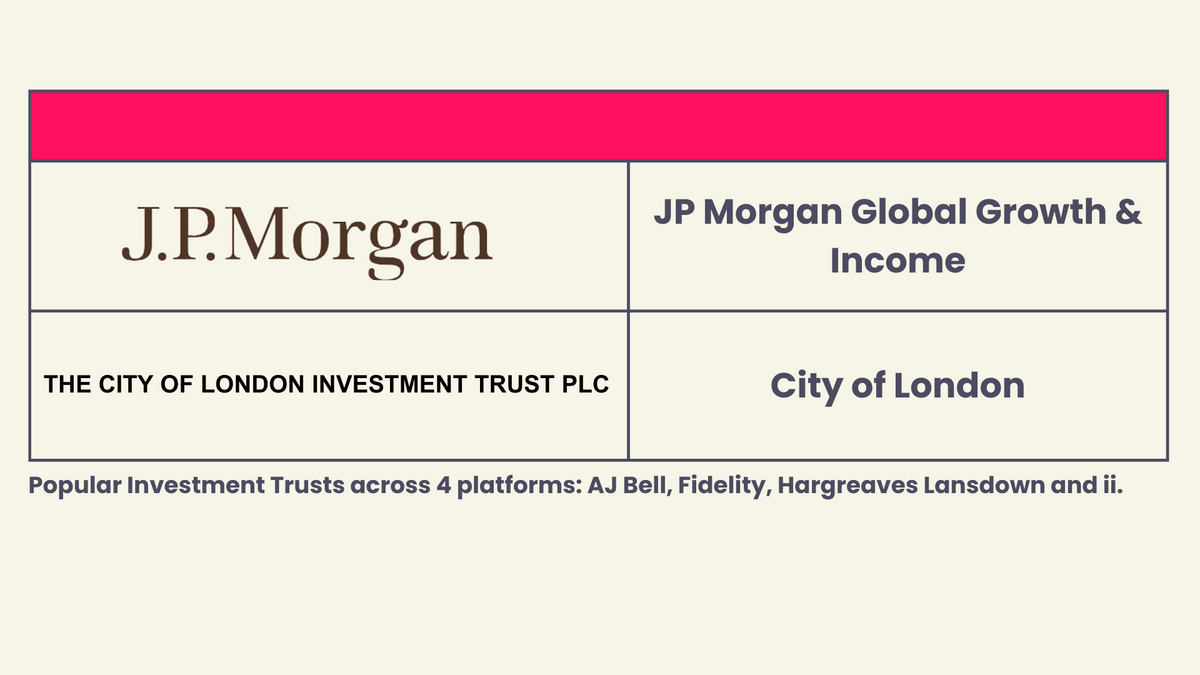
The City of London Investment Trust appeared in all four platforms' bestselling Investment Trust lists in October. The Trust aims to provide long-term in income and capital, principally by investing in equities listed on the London Stock Exchange, and has close to £2b in assets under management.
The Top three largest holdings are Shell, Unilever, and BAE Systems. The latter is a British multinational arms, security, and aerospace company, and is one of the largest defense contractors in the world. The stock price has more than doubled in the past 5 years and is up by over 10% in October.
Ethical investors should stay away; weapons, tobacco, alcohol, and oil are all prevalent holdings within the portfolio. In total, the portfolio consists of 86 holdings across a wide range of sectors, with a UK exposure of 83%. It trades at close to NAV and currently has a dividend yield of 5.32%.
Best-selling investment trusts from AJ Bell
Investment Trusts | 3 year performance | 5 year performance | Ongoing Charges Figure |
JP Morgan Global Growth & Income | 53.63% | 84.57% | 0.53% |
Scottish Mortgage | -34.62% | 36.46% | 0.34% |
BlackRock World Mining | 59.14% | 111.53% | 0.99% |
Renewables Infrastructure | -12.40% | 15.79% | 0.88% |
Alliance Trust | 32.07% | 52.34% | 0.64% |
Law Debenture | 64.88% | 59.85% | 0.49% |
Personal Assets | 9.50% | 23.69% | 0.67% |
City Of London | 39.28% | 18.68% | 0.45% |
Gore Street Energy Storage | -24.01% | -5.23% | 1.31% |
HICL Infrastructure | -21.00% | -3.23% | 1.06% |
Best-selling investment trusts from Fidelity
Investment Trusts | 3 year performance | 5 year performance | Ongoing Charges Figure |
Fidelity European Trust | 38.49% | 64.51% | 0.78% |
Scottish Mortgage | -34.62% | 36.46% | 0.34% |
JP Morgan Global Growth & Income | 53.63% | 84.57% | 0.53% |
City of London | 39.28% | 18.68% | 0.45% |
Fidelity Special Values | 58.24% | 13.34% | 0.69% |
CT Private Equity | 70.29% | 67.36% | 1.30% |
Edinburgh | 65.65% | 23.89% | 0.53% |
Merchants | 68.15% | 34.29% | 0.59% |
Greencoat UK Wind | 17.28% | 34.93% | 1.03% |
F&C | 29.03% | 36.39% | 0.59% |
Best-selling investment trusts from Hargreaves Lansdown
Investment Trusts | 3 year performance | 5 year performance | Ongoing Charges Figure |
City of London | 39.28% | 18.68% | 0.45% |
JP Morgan Global Growth & Income | 53.63% | 84.57% | 0.53% |
Greencoat UK Wind | 17.28% | 34.93% | 1.03% |
European Opportunities | 15.78% | -0.68% | 1.05% |
CVC Income & Growth | 31.92% | 17.89% | 1.54% |
Gore Street Energy Storage | -24.01% | -5.23% | 1.31% |
GCP Infrastructure Investments | -31.20% | -31.81% | 1.13% |
Tritax Eurobox | -40.91% | -43.62% | 1.60% |
HICL Infrastructure | -21.00% | -3.23% | 1.06% |
Henderson Far East Income | -10.70% | -14.34% | 1.09% |
Best-selling investment trusts from interactive investor
Investment Trusts | 3 year performance | 5 year performance | Ongoing Charges Figure |
City of London | 39.28% | 18.68% | 0.45% |
Scottish Mortgage | -34.62% | 36.46% | 0.34% |
Greencoat UK Wind | 17.28% | 34.93% | 1.03% |
Merchants | 68.15% | 34.29% | 0.59% |
BlackRock World Mining | 59.14% | 111.53% | 0.99% |
Alliance Trust | 32.07% | 52.34% | 0.64% |
JP Morgan Global Growth & Income | 53.63% | 84.57% | 0.53% |
Gore Street Energy Storage | -24.01% | -5.23% | 1.31% |
HICL Infrastructure | -21.00% | -3.23% | 1.06% |
F&C | 29.03% | 36.39% | 0.59% |
Performance has been calculated in accordance with end-of-day market prices on 31/10/2023.
Best-selling ETFs of October 2023
The three most popular ETFs across AJ Bell, Fidelity, Hargreaves Lansdown and interactive investor were Vanguard S&P 500 GBP(VUSA), Vanguard FTSE All-World(VWRL) and iShares Core FTSE 100(ISF).

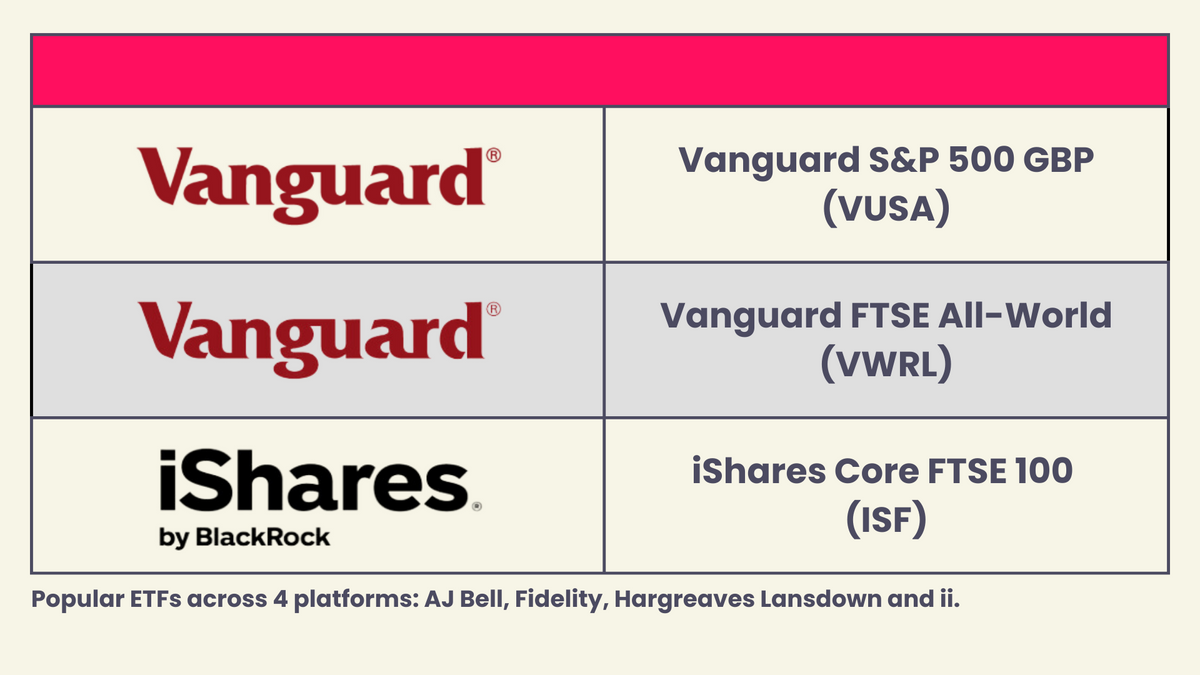
The FTSE 100 was in the Top 10 bestselling ETFs of all four platforms in October, after missing out in September. Performance of the Index was strong in September, with growth of over 2%, however, October actually saw a drop of close to 4%. This made it the worst performing month for the FTSE 100 since May. This poor performance can be partially attributed to commodities, with BP, Shell, and the broader oil and gas sector all returning negatively, as these companies feel the effect of a drop in energy prices compared to this time last year.
The International Monetary Fund (IMF), which is a major financial agency of the UN, has downgraded its forecasts for economic growth in the UK in 2023 and 2024. One of the reasons for this is the stubborn nature of the high inflation, which remained at 6.7% in September. Whilst the current rate is lower than the 41-year high of 11.1% in October 2022, it is still substantially higher than the Bank of England's 2% target rate.
Best-selling ETFs from AJ Bell
ETFs | 3 year performance | 5 year performance | Ongoing Charges Figure |
Vanguard S&P 500 UCITS ETF (VUSA) | 42.01% | 74.04% | 0.07% |
Vanguard FTSE All-World UCITS ETF (VWRL) | 29.57% | 50.85% | 0.22% |
Vanguard S&P 500 UCITS ETF USD Acc (VUAG) | 42.01% | N/A | 0.07% |
iShares Core FTSE 100 (ISF) | 46.15% | 23.68% | 0.07% |
iShares Core S&P 500 UCITS ETF USD (CSP1) | 42.01% | 74.81% | 0.07% |
Vanguard FTSE 250 UCITS (VMID) | 7.09% | 2.13% | 0.10% |
iShares Physical Gold ETC (SGLN) | 12.63% | 71.63% | 0.12% |
iShares Core S&P 500 UCITS ETF (IUSA) | 42.03% | 74.98% | 0.07% |
Invesco NASDAQ 100 UCITS (EQQQ) | 40.56% | 122.99% | 0.30% |
Vanguard FTSE Dev Europe ex-UK ETF (VERX) | 30.19% | 38.27% | 0.10% |
Best-selling ETFs from Fidelity
ETFs | 3 year performance | 8 year performance | Ongoing Charges Figure |
iShares Core FTSE 100 (ISF) | 46.15% | 23.68% | 0.07% |
Vanguard S&P 500 UCITS ETF (VUSA) | 42.01% | 74.04% | 0.07% |
Invesco NASDAQ 100 UCITS (EQQQ) | 40.56% | 122.99% | 0.30% |
iShares Physical Gold ETC (SGLN) | 12.63% | 71.63% | 0.12% |
Vanguard S&P 500 UCITS ETF USD Acc (VUAG) | 42.01% | N/A | 0.07% |
iShares Core S&P 500 UCITS ETF USD (CSP1) | 42.01% | 74.81% | 0.07% |
Vanguard FTSE 100 (VUKE) | 46.16% | 23.52% | 0.09% |
iShares S&P 500 Information Technology (IITU) | 61.13% | 158.94% | 0.15% |
iShares NASDAQ 100 UCITS ETF USD (CNX1) | 40.43% | 122.55% | 0.33% |
Vanguard FTSE All-World UCITS ETF (VWRL) | 29.57% | 50.85% | 0.22% |
Best-selling ETFs from Hargreaves Lansdown
ETFs | 3 year performance | 5 year performance | Ongoing Charges Figure |
Lyxor Smart Cash (CSH2) | 5.60% | 6.91% | 0.07% |
iShares Core FTSE 100 (ISF) | 46.15% | 23.68% | 0.07% |
Vanguard FTSE All-World UCITS ETF USD (VWRP) | 29.57% | N/A | 0.22% |
iShares USD Tips 0-5 UCITS ETF GBP Hedged (TI5G) | 4.40% | 10.32% | 0.12% |
WisdomTree FTSE 100 3x Daily Leveraged (3UKL) | 120.60% | -9.21% | 2.15% |
Vanguard FTSE All-World UCITS ETF (VWRL) | 29.57% | 50.85% | 0.22% |
Vanguard FTSE 250 UCITS (VMID) | 7.09% | 2.13% | 0.10% |
SSGA SPDR ETFS Europe MSCI World UCITS ETF (SWLD) | 35.51% | N/A | 0.12% |
Vanguard S&P 500 UCITS ETF GBP (VUSA) | 42.01% | 74.04% | 0.07% |
iShares MSCI ACWI UCITS ETF (SSAC) | 30.02% | 50.57% | 0.20% |
Best-selling ETFs from interactive investor
ETFs | 3 year performance | 5 year performance | Ongoing Charges Figure |
Vanguard S&P 500 UCITS ETF (VUSA) | 42.01% | 74.04% | 0.07% |
iShares Core FTSE 100 (ISF) | 46.15% | 23.68% | 0.07% |
iShares Core MSCI World (SWDA) | 35.15% | 57.23% | 0.20% |
Vanguard FTSE All-World UCITS ETF (VWRL) | 29.57% | 50.85% | 0.22% |
Vanguard S&P 500 (VUAG) | 42.01% | N/A | 0.07% |
WisdomTree FTSE 100 3x Daily Leveraged (3UKL) | 120.60% | -9.21% | 2.15% |
WisdomTree NASDAQ 100 3x Daily Short (LQQS) | -80.83% | -98.24% | 1.60% |
iShares Physical Gold ETC (SGLN) | 12.63% | 71.63% | 0.12% |
Lyxor Smart Overnight Return ETF (CSH2) | 5.60% | 6.91% | 0.07% |
Vanguard FTSE 100 (VUKE) | 46.16% | 23.52% | 0.09% |
Performance has been calculated in accordance with end-of-day market prices on 31/10/2023.