Best-selling funds, investment trusts and ETFs of September 2023
Discover the most-bought investments across four major platforms
By Boring Money
11 Oct, 2023
Every month, Boring Money conducts rigorous research on what the best-selling investments were across the UK's major investment platforms - including AJ Bell, Fidelity, Hargreaves Lansdown and interactive investor. Scroll down for the full results and expert insights.
Boring Money's expert analysis
UK markets performed well in September, with the economic data coming in exceeding expectations. UK inflation dropped to 6.7% in August, significantly lower than the circa 10-11% we saw between September 2022 - March 2023. The Bank of England also ended a run of 14 straight interest rate hikes, holding interest rates at 5.25%.
Best-selling funds of September 2023
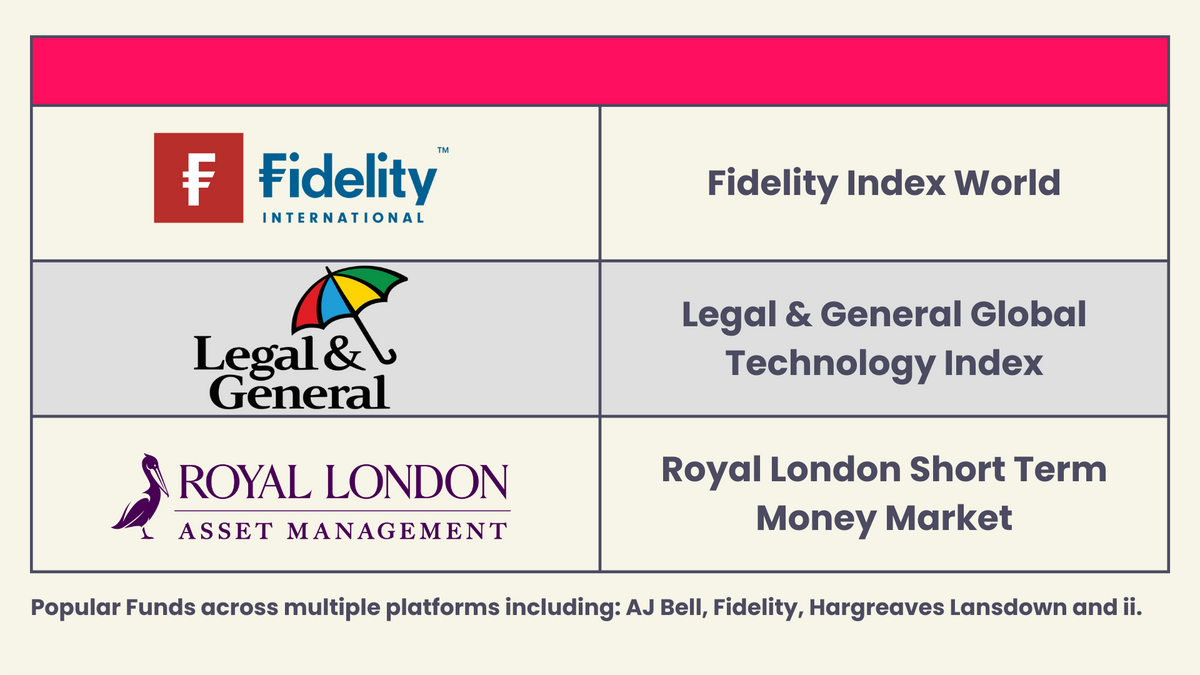
The three most popular funds across multiple platforms including AJ Bell, Fidelity, Hargreaves Lansdown and interactive investor were Fidelity Index World, Legal & General Global Technology Index and Royal London Short Term Money Market.

Fidelity Index World continues to prove a popular fund choice, with low fees and consistently strong performance. The fund aims to track the performance of the MSCI World Index, which seeks to capture the performance of large and mid-sized public companies across 23 developed market countries. Effectively, this acts as a proxy for the global economy and suits investors looking for cheap, diversified access to stocks around the world.
L&G Global Technology has a specific focus on the IT sector, tracking the FTSE World Technology Index. 85% of the fund is held in US equities, with a large concentration in specific stocks, including 18% in Apple and 17% in Microsoft. This has been hugely advantageous for the fund in 2023, with both Apple and Microsoft bouncing back from dips last year to return 43% and 37% YTD respectively.
Money market funds invest in highly liquid, short-term investments, including cash and cash equivalents, alongside high-credit rating debts such as the US treasury. Money market funds are designed to offer liquidity and can act as a place to park your money when you're not sure what to invest in, or when markets feel choppy and you'd rather wait for more clarity. They also allow you to benefit from cash rates, offering better returns than bank accounts. As money market funds are invested in short-term securities, fund managers can roll over investments to higher-yielding securities, allowing them to benefit from interest rate increases quickly.
Best-selling funds from AJ Bell
Funds | 3 year performance | 5 year performance | Ongoing Charges Figure |
AJ Bell Adventurous | 28.67% | 36.72% | 0.31% |
AJ Bell Moderately Adventurous | 20.64% | 28.72% | 0.31% |
AJ Bell Global Growth | 28.89% | 36.64% | 0.31% |
AJ Bell Balanced | 14.53% | 24.78% | 0.31% |
Fidelity Index World | 34.77% | 53.02% | 0.12% |
Fundsmith Equity | 17.24% | 51.46% | 0.94% |
AJ Bell Responsible | N/A | N/A | 0.45% |
Vanguard LifeStrategy 100% Equity | 31.36% | 38.88% | 0.22% |
Vanguard LifeStrategy 80% Equity | 18.88% | 28.14% | 0.22% |
Vanguard FTSE Global All Cap | 29.05% | 43.27% | 0.23% |
Best-selling funds from Fidelity
Funds | 3 year performance | 5 year performance | Ongoing Charges Figure |
Fidelity Index World | 34.77% | 53.02% | 0.12% |
Fidelity Index US Fund | 41.48% | 69.12% | 0.06% |
Fidelity Cash Fund | 4.47% | 5.62% | 0.15% |
Royal London Short Term Money Market | 4.79% | 6.04% | 0.10% |
Fidelity Funds - Global Technology | 50.70% | 133.22% | 1.04% |
Legal & General UK Index Trust | 40.19% | 19.80% | 0.10% |
Legal & General Cash Trust | 4.53% | 5.65% | 0.15% |
Legal & General Global Technology Index | 44.01% | 124.35% | 0.32% |
Fidelity Global Special Situations | 24.31% | 39.17% | 0.91% |
Rathbone Global Opportunities | 9.54% | 44.99% | 0.51% |
Best-selling funds from Hargreaves Lansdown (in alphabetical order)
Funds | 3 year performance | 5 year performance | Ongoing Charges Figure |
Fidelity Index World | 34.77% | 53.02% | 0.12% |
Jupiter India | 91.40% | 77.24% | 0.69% |
Legal & General Cash Trust | 4.53% | 5.65% | 0.15% |
Legal & General Global 100 Index | 46.00% | 77.06% | 0.09% |
Legal & General Global Technology Index Trust | 44.58% | 125.53% | 0.20% |
Legal & General International Index Trust | 33.59% | 53.17% | 0.08% |
Legal & General US Index | 38.51% | 69.12% | 0.05% |
Pictet Premium Brands | 30.07% | 52.32% | 2.00% |
Pictet Security | 2.78% | 24.94% | 1.99% |
Royal London Short Term Money Market | 4.79% | 6.04% | 0.10% |
It has been a good start to the 2023/24 tax year for investors looking for low-risk returns. Cash, which for so many years has been a dead zone asset class, has offered a decent yield thanks to ever rising interest rates. The Bank of England has hiked base rate three times this tax year alone, and on top of 10 previous consecutive rises. And while many are now calling the top of the interest rate cycle, it has meant cash savings accounts, and money market funds are offering an enticing yield to savers and investors.
If you’ve been investing for income over the previous decade equities have been most compelling asset class. But today, lower risk assets such as corporate bonds, government bonds including gilts, and even cash, are giving equity yields a run for their money.
It is apparent that HL clients are aware of this, with money market funds being the most popular sector in the first half of this tax year. The top 10 most bought funds include no less than six money market funds, alongside three global funds, with a growth-style bias and one Indian equity fund. This mix is typical of the top 50 most bought funds – money market funds dominate the most popular list, alongside a peppering of technology funds, quality growth equity funds, and regional equity funds covering the US, Europe and India.
A word of warning to investors planning to continue these trends however – it is only equities that can offer dividend growth and capital growth, so if you’re looking to build a portfolio with a sustainable income and the opportunity to beat inflation over the long term, make sure you have a balanced portfolio which includes a mix of equities, bonds, alternatives and cash.”
Best-selling funds from interactive investor
Funds | 3 year performance | 5 year performance | Ongoing Charges Figure |
Fundsmith Equity | 17.24% | 51.46% | 0.94% |
Royal London Short Term Money Market | 4.79% | 6.04% | 0.10% |
Vanguard LifeStrategy 80% Equity | 18.88% | 28.14% | 0.22% |
Legal & General Global Technology Index | 44.01% | 124.35% | 0.32% |
Vanguard US Equity Index | 36.95% | 61.85% | 0.10% |
Vanguard LifeStrategy 100% Equity | 31.36% | 38.88% | 0.22% |
HSBC FTSE All-World Index | 29.67% | 47.12% | 0.13% |
Legal & General Global 100 Index | 45.81% | 76.74% | 0.14% |
Jupiter India | 89.69% | 74.42% | 0.99% |
Vanguard FTSE Global All Cap | 29.05% | 43.27% | 0.23% |
Performance has been calculated in accordance with end-of-day market prices on 30/09/2023.
Best-selling investment trusts of September 2023
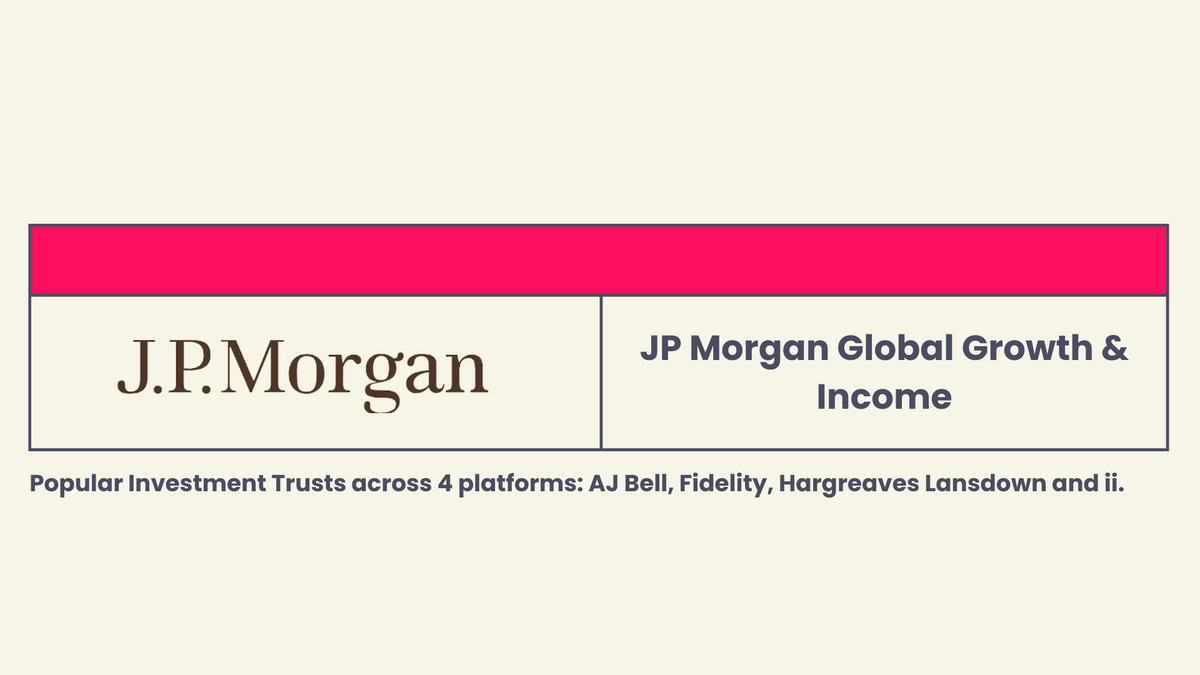
The most popular investment trust across AJ Bell, Fidelity, Hargreaves Lansdown and interactive investor was JP Morgan Global Growth & Income.

JP Morgan Global Growth & Income was in the bestselling list of all 4 platforms every month over the last quarter. The trust is trading at a 2% premium to its NAV; premiums indicate high demand and/or expectations that the underlying investments in the Trust have a market value lower than their (subjective) intrinsic value.
Interestingly, 2 of the 4 largest individual holdings in the Trust are cash equivalents, which are liquid, low-risk investments. The 3 largest stock holdings are Microsoft, Amazon, and UnitedHealth Group. Amazon's performance has been excellent YTD, with 50% growth in the share price, although it has dropped by 10% in the last month. On the other hand, UnitedHealth Group have been maintained relatively flat across 2023, with 1% growth YTD, although the share price is up 9% in the past month.
Best-selling investment trusts from AJ Bell
Investment Trusts | 3 year performance | 5 year performance | Ongoing Charges Figure |
City Of London | 46.15% | 19.74% | 0.45% |
Scottish Mortgage | -31.59% | 26.70% | 0.34% |
Monks | -15.61% | 13.66% | 0.40% |
JP Morgan Global Growth & Income | 48.73% | 72.34% | 0.53% |
Witan | 29.15% | 14.93% | 1.32% |
Bankers | 1.88% | 20.26% | 0.50% |
Scottish American | 21.86% | 50.50% | 0.59% |
BlackRock Throgmorton | 2.36% | 13.29% | 0.60% |
Tritax Big Box | -0.51% | 13.92% | 0.86% |
Impax Environmental Markets | 7.45% | 36.33% | 0.81% |
Best-selling investment trusts from Fidelity
Investment Trusts | 3 year performance | 5 year performance | Ongoing Charges Figure |
Scottish Mortgage | -31.59% | 26.70% | 0.34% |
BH Macro | -2.47% | 59.95% | 1.13% |
Fidelity European Trust | 37.90% | 64.01% | 0.78% |
JP Morgan Global Growth & Income | 48.73% | 72.34% | 0.53% |
Fidelity Special Values | 68.17% | 13.37% | 0.69% |
City of London | 46.15% | 19.74% | 0.45% |
Monks | -15.61% | 13.66% | 0.40% |
Edinburgh Worldwide | -52.26% | -29.02% | 0.63% |
Fidelity China Special Situations | -32.90% | 7.17% | 1.18% |
International Public Partnerships | -10.97% | 4.05% | 1.09% |
Best-selling investment trusts from Hargreaves Lansdown (in alphabetical order)
Investment Trusts | 3 year performance | 5 year performance | Ongoing Charges Figure |
Ashoka India Equity | 97.00% | 138.44% | 0.50% |
BlackRock World Mining | 73.52% | 117.28% | 0.99% |
CVC Income & Growth | 29.78% | 13.98% | 1.54% |
Greencoat UK Wind | 22.35% | 41.24% | 1.03% |
HICL Infrastructure | -12.86% | 3.95% | 1.06% |
India Capital Growth | 129.89% | 83.91% | 1.62% |
International Public Partnerships | -10.97% | 4.05% | 1.09% |
JP Morgan Global Growth & Income | 48.73% | 72.34% | 0.53% |
Scottish Oriental Smaller Cos | 55.61% | 48.76% | 1.03% |
Sequoia Economic Infrastructure Income | -2.74% | 3.42% | 0.87% |
Best-selling investment trusts from interactive investor
Investment Trusts | 3 year performance | 5 year performance | Ongoing Charges Figure |
Scottish Mortgage | -31.59% | 26.70% | 0.34% |
Greencoat UK Wind | 22.35% | 41.24% | 1.03% |
City of London | 46.15% | 19.74% | 0.45% |
India Capital Growth | 129.89% | 83.91% | 1.62% |
Regional REIT | -45.47% | -58.13% | 4.60% |
JP Morgan Global Growth & Income | 48.73% | 72.34% | 0.53% |
BlackRock World Mining | 73.52% | 117.28% | 0.99% |
Alliance Trust | 35.72% | 48.27% | 0.64% |
F&C | 35.32% | 31.96% | 0.59% |
3i Group | 130.93% | 163.82% | 1.30% |
Performance has been calculated in accordance with end-of-day market prices on 30/09/2023.
Best-selling ETFs of September 2023
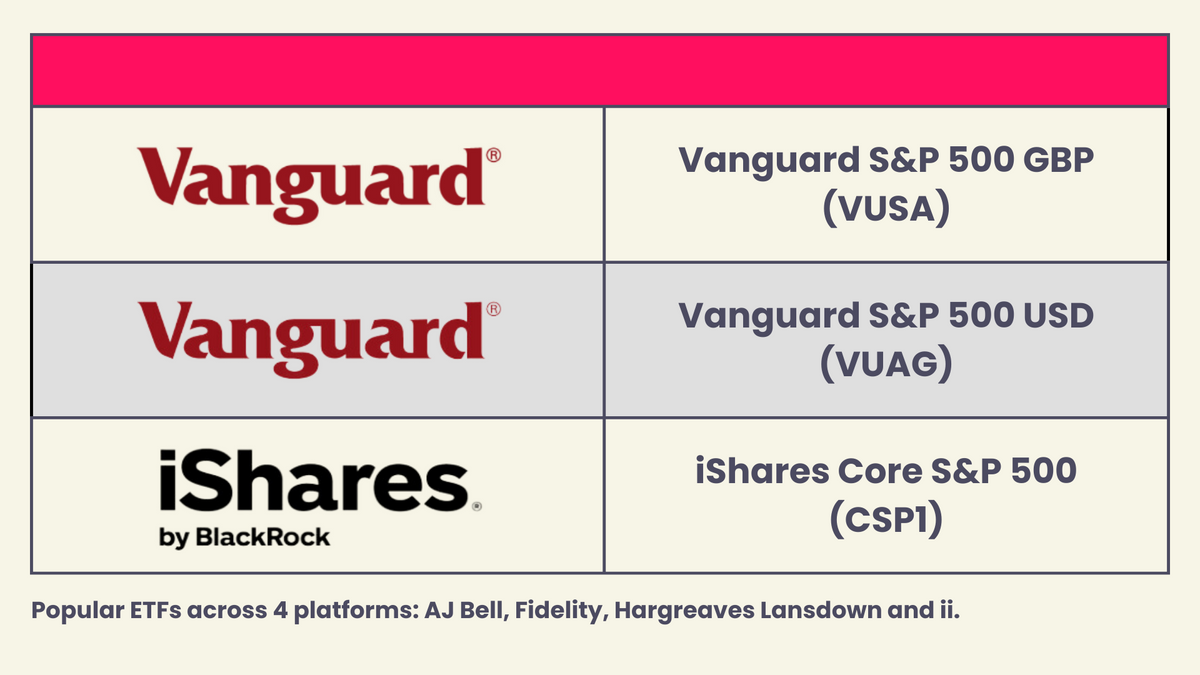
The three most popular ETFs across AJ Bell, Fidelity, Hargreaves Lansdown and interactive investor were Vanguard S&P 500 GBP (VUSA), Vanguard S&P 500 USD (VUAG) and iShares Core S&P 500
(CSP1).

S&P 500 ETFs continue to remain popular, with iShares and Vanguard's trackers appearing on the bestselling list of all 4 platforms this month. Flows into ETFs in general have been rapidly rising across the last decade, with research from the consultancy Oliver Wyman indicating that the total AUM (assets under management) of ETFs has grown at approx 15% per year since 2010, which is almost 3x faster than traditional mutual funds. The consultancy forecast ETFs to account for 24% of total fund assets by 2027, up from 17% today.
The rise in ETF ownership can be put down to a few potential factors. Costs are much lower than mutual funds, with no communication costs incurred by the provider and no active research conducted. As ETFs are listed on the stock exchange, they can be traded during the day and allow for more sophisticated order types, such as limit pricing or stop-losses.
ETFs are also very tax-efficient in their structure, unlike mutual funds. Mutual funds work by pooling together the money of lots of investors into a single fund. When an individual/company invested in the mutual fund wants to sell their fund holdings to redeem cash, the fund manager needs to actually sell a proportion of all the stocks in the fund, which can trigger capital gain taxes on profitable investments for the fund, which will reduce the fund returns. Whilst the impact of this on an individual is negligible, conceptually speaking, everyone in the mutual fund can be impacted by one person's withdrawal. This issue does not occur with ETFs, with the impact of withdrawals localised to the individual.
Best-selling ETFs from AJ Bell
ETFs | 3 year performance | 5 year performance | Ongoing Charges Figure |
Vanguard S&P 500 UCITS ETF (VUSA) | 40.36% | 68.05% | 0.07% |
Vanguard S&P 500 UCITS ETF USD Acc (VUAG) | 40.36% | N/A | 0.07% |
iShares Core S&P 500 UCITS ETF USD (CSP1) | 40.36% | 68.79% | 0.07% |
iShares Core FTSE 100 (ISF) | 44.55% | 22.12% | 0.07% |
Vanguard FTSE All-World UCITS ETF (VWRL) | 29.49% | 45.98% | 0.22% |
iShares Physical Gold ETC (SGLN) | 4.59% | 66.91% | 0.12% |
iShares Core MSCI World (SWDA) | 34.11% | 52.23% | 0.20% |
Vanguard FTSE All-World UCITS ETF USD (VWRP) | 29.49% | N/A | 0.22% |
Vanguard FTSE 250 UCITS (VMID) | 13.82% | 1.77% | 0.10% |
Invesco NASDAQ 100 UCITS (EQQQ) | 38.12% | 111.03% | 0.30% |
Best-selling ETFs from Fidelity
ETFs | 3 year performance | 5 year performance | Ongoing Charges Figure |
iShares Core FTSE 100 (ISF) | 44.55% | 22.12% | 0.07% |
Vanguard S&P 500 UCITS ETF (VUSA) | 40.36% | 68.05% | 0.07% |
iShares S&P 500 Information Technology (IITU) | 52.77% | 143.09% | 0.15% |
iShares Core S&P 500 UCITS ETF USD (CSP1) | 40.36% | 68.79% | 0.07% |
Vanguard FTSE All-World UCITS ETF (VWRL) | 29.49% | 45.98% | 0.22% |
Invesco NASDAQ 100 UCITS (EQQQ) | 38.12% | 111.03% | 0.30% |
Vanguard S&P 500 UCITS ETF USD Acc (VUAG) | 40.36% | N/A | 0.07% |
iShares S&P 500 Energy Sector UCITS ETF (IESU) | 260.97% | 58.85% | 0.15% |
HSBC MSCI World UCITS ETF (HMWO) | 34.49% | 53.42% | 0.15% |
iShares NASDAQ 100 UCITS ETF USD (CNX1) | 37.99% | 110.63% | 0.33% |
Best-selling ETFs from Hargreaves Lansdown (in alphabetical order)
ETFs | 3 year performance | 5 year performance | Ongoing Charges Figure |
iShares Core S&P 500 UCITS ETF (IUSA) | 40.38% | 68.96% | 0.07% |
iShares Core S&P 500 UCITS ETF USD (CSP1) | 40.36% | 68.79% | 0.07% |
Leverage Shares 3x Nvidia ETP (3NVD) | 139.15% | N/A | 3.78% |
Lyxor Smart Cash (CSH2) | 5.14% | 6.51% | 0.07% |
Vanguard FTSE All-World UCITS ETF USD (VWRP) | 29.49% | N/A | 0.22% |
Vanguard S&P 500 UCITS ETF USD Acc (VUAG) | 40.36% | N/A | 0.07% |
Vanguard S&P 500 UCITS ETF GBP (VUSA) | 40.36% | 68.05% | 0.07% |
WisdomTree Brude Crude Oil 3x Daily Short (3BSR) | -99.56% | -99.97% | 3.49% |
WisdomTree NASDAQ 100 3x Daily Leveraged (LQQ3) | 19.02% | 121.41% | 0.75% |
WisdomTree Natural Gas 3x Daily Short (3LGS) | -99.59% | -99.87% | 3.76% |
Best-selling ETFs from interactive investor
ETFs | 3 year performance | 5 year performance | Ongoing Charges Figure |
Vanguard S&P 500 UCITS ETF (VUSA) | 40.36% | 68.05% | 0.07% |
Vanguard S&P 500 (VUAG) | 40.36% | N/A | 0.07% |
iShares Core MSCI World (SWDA) | 34.11% | 52.23% | 0.20% |
iShares Core FTSE 100 (ISF) | 44.55% | 22.12% | 0.07% |
Vanguard FTSE All-World UCITS ETF (VWRL) | 29.49% | 45.98% | 0.22% |
WisdomTree NASDAQ 100 3x Daily Short (LQQS) | -81.05% | -97.91% | 1.60% |
Lyxor Smart Overnight Return ETF (CSH2) | 5.14% | 6.51% | 0.07% |
Invesco NASDAQ 100 UCITS (EQQQ) | 38.12% | 111.03% | 0.30% |
iShares Core S&P 500 UCITS ETF USD (CSP1) | 40.36% | 68.79% | 0.07% |
Vanguard FTSE 100 (VUKE) | 44.58% | 22.05% | 0.09% |
Performance has been calculated in accordance with end-of-day market prices on 30/09/2023.


