Best-selling funds, Investment Trusts and ETFs of May 2026
Discover the most popular investments on the UK's top platforms
By Boring Money
9 June, 2026
Every month, Boring Money conducts rigorous research on what the best-selling investments were across the UK's major investment platforms - including AJ Bell, Fidelity, Hargreaves Lansdown and interactive investor.
Boring Money's expert analysis
Best-selling funds | May 2026
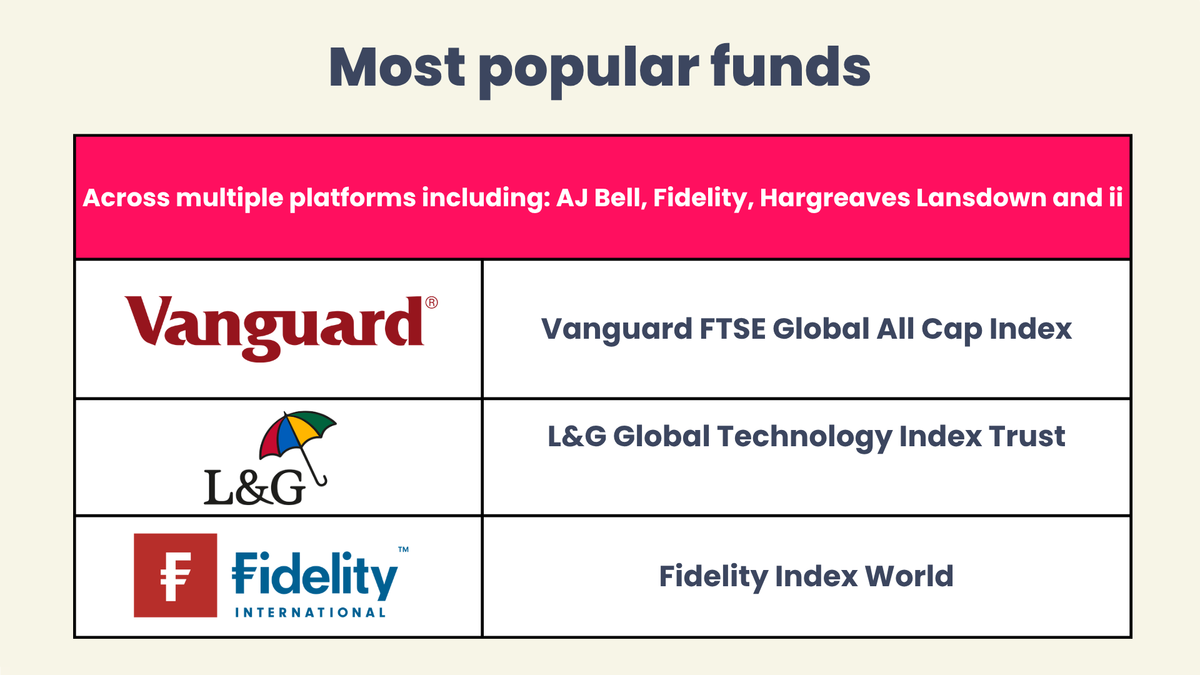
The most popular funds across multiple platforms, including AJ Bell, Fidelity, Hargreaves Lansdown and interactive investor were, Vanguard FTSE Global All Cap Index, L&G Global Technology Index Trust and Fidelity Index World.

Best-selling funds from AJ Bell
Fund | 3 year performance | 5 year performance | OCF | Sector |
AJ Bell Adventurous I Acc | 56.2% | 70.4% | 0.31% | Flexible Investment |
AJ Bell Moderately Adv I Acc | 46.4% | 54.7% | 0.31% | Flexible Investment |
AJ Bell Global Growth I Acc | 57.3% | 67.5% | 0.31% | Flexible Investment |
Vanguard FTSE Global All Cp Idx £ Acc | 66.2% | 76.3% | 0.23% | Global |
AJ Bell Balanced I Acc | 37.7% | 42.9% | 0.31% | Flexible Investment |
HSBC FTSE All-World Index C Acc | 67.5% | 82.9% | 0.13% | UTGlobal |
Fidelity Index World | Acc | 65.9% | 86.5% | 0.12% | Global |
Vanguard LifeStrategy 100% Equity A Acc | 64.9% | 77.7% | 0.20% | Global |
Vanguard LifeStrategy 80% Equity A Acc | 52.3% | 55.7% | 0.20% | Global |
L&G Global Technology Index I Acc | 137.4% | 192.2% | 0.31% | Flexible Investment |
Performance figures are retrieved from FE FundInfo on a Total Return basis.
Best-selling funds from Fidelity
Fund | 3 year performance | 5 year performance | OCF | Sector |
Fidelity Cash Fund | Acc | 14.9% | 18.1% | 0.15% | Short Term Money Market |
Fidelity Index World Fund | 65.9% | 86.5% | 0.12% | Global |
Royal London Short Term Money Market Fund Acc | 15.2% | 18.6% | 0.10% | Volatility Managed |
Legal & General Global Tech Index I Acc | 137.4% | 192.2% | 0.31% | Technology and Technology Innovation |
Artemis Global Income Fund Class | 159.8% | 165.3% | 0.83% | UT Global Equity Income |
| 263.3% | 261.9% | 1.10% | Equity - Tech Media & Telecom |
Fidelity Funds - Global Technology Fund W-Acc-GBP | 93.2% | 120.3% | 1.04% | Tech Media & Telecom |
Vanguard FTSE Glbl All Cap Idx GBP Acc | 66.2% | 76.3% | 0.23% | Global |
Lazard Emerging Markets A Acc | 100.1% | 97.0% | 1.04% | Global Emerging Markets Retail |
Fidelity Global Dividend W-Acc (UK) | 50.8% | 67.7% | 0.91% | Global Equity Income |
Performance figures are retrieved from FE FundInfo on a Total Return basis.
Best-selling funds from Hargreaves Lansdown
Fund | 3 year performance | 5 year performance | OCF | Sector |
HL Growth Fund | 52.4% | N/A | 0.10% | Volatility Managed |
Vanguard FTSE Glbl All Cap Idx GBP Acc | 66.2% | 76.3% | 0.23% | Global |
HL Multi-Index Moderately Adventurous (Class D) | N/A | N/A | 0.87% | Volatility Managed |
L&G International Index Trust C Acc in GB | 73.0% | 90.6% | 0.08% | Global |
Fidelity Index World | 65.9% | 86.5% | 0.12% | Global |
HL Adventurous Managed | 54.7% | N/A | 0.87% | Volatility Managed |
UBS S&P 500 Index | 72.4% | 101.2% | 0.09% | North America |
HL Moderately Adventurous Managed | 45.5% | N/A | 0.88% | Volatility Managed |
Legal & General US Index | 73.1% | 97.4% | 0.10% | Volatility Managed |
Legal & General Global Technology Index Trust | 137.4% | 192.2% | 0.31% | Flexible Investment |
Performance figures are retrieved from FE FundInfo on a Total Return basis.
Best-selling funds from interactive investor
Fund | 3 year performance | 5 year performance | OCF | Sector |
Royal London Short Term Money Market (Acc) | 15.2% | 18.6% | 0.10% | Volatility Managed |
Vanguard FTSE Global All Cp Idx £ Acc | 66.2% | 76.3% | 0.23% | Global |
HSBC FTSE All-World Index C Acc | 67.5% | 82.9% | 0.13% | Global |
Artemis Global Income I Acc | 159.8% | 165.3% | 0.83% | Global Equity Income |
Vanguard LifeStrategy 80% Equity | 52.3% | 55.7% | 0.20% | Global |
L&G Global Technology Index Trust | 137.4% | 192.2% | 0.31% | Flexible Investment |
Vanguard LifeStrategy 100% Equity A Acc | 64.9% | 77.7% | 0.20% | Global |
Vanguard LifeStrategy 60% Equity A Acc | 40.5% | 36.3% | 0.20% | Global |
Fidelity Index World | 65.9% | 86.5% | 0.12% | Global |
Polar Capital Global Tech I Inc GBP | 263.3% | 261.9% | 1.10% | Equity - Tech Media & Telecom |
Performance figures are retrieved from FE FundInfo on a Total Return basis.
Data provided by FE FundInfo, correct as at 31 May 2026.
Best-selling Investment Trusts | May 2026
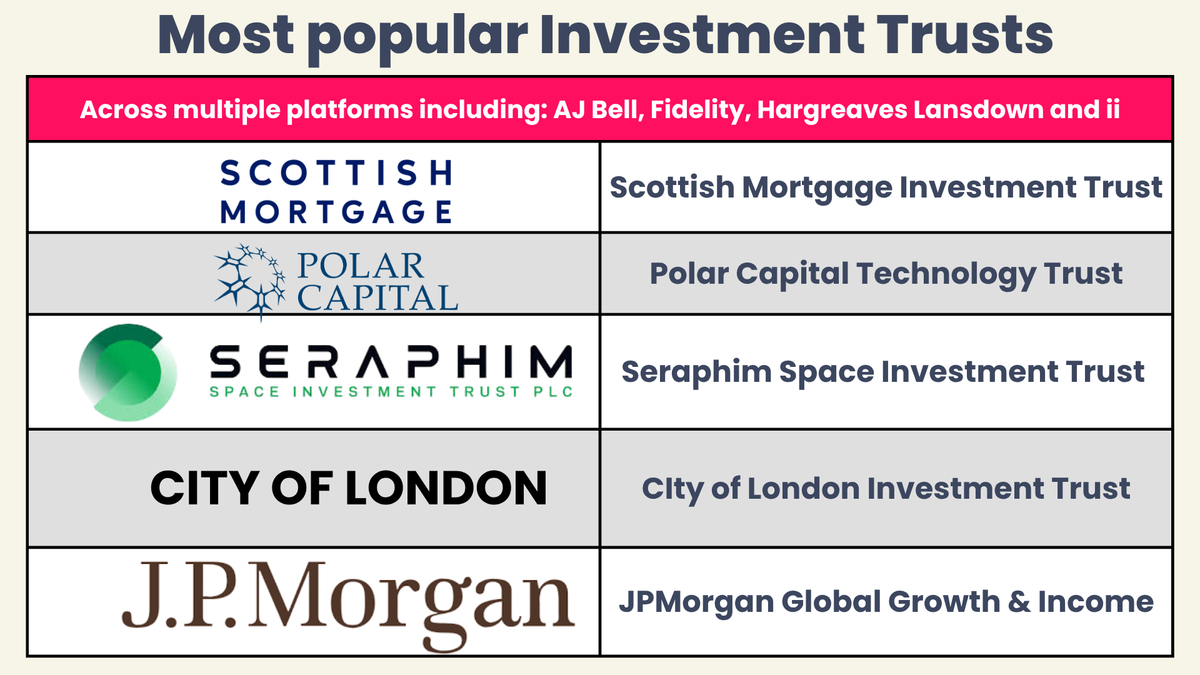
The most popular Investment Trusts across AJ Bell, Fidelity, Hargreaves Lansdown, and interactive investor were Scottish Mortgage, City of London, and Polar Capital Technology Trust, Seraphim Space Investment Trust and JPMorgan Global Growth & Income Ord.

Best-selling Investment Trusts from AJ Bell
Investment Trust | 3 year performance | 5 year performance | OCF | Sector |
Scottish Mortgage Ord | 132.0% | 30.2% | 0.31% | Global |
Polar Capital Technology Ord | 222.0% | 222.0% | 0.77% | Technology & Technology Innovati |
Seraphim Space Investment Trust Ord | 573.9% | N/A | 1.79%* | IT Growth Capital |
Murray International Ord | 63.5% | 96.3% | 0.59% | Global Equity Income |
City of London Ord | 58.2% | 78.1% | 0.36% | UK Equity Income |
3i Group PLC | 24.6% | 110.9% | 0.67% | Private Equity |
Merchants Trust PLC | 32.6% | 52.6% | 0.54% | UK Equity Income |
JPMorgan Emerging Markets Growth & Income PLC | 75.1% | 38.3% | 0.79% | Global Emerging Markets |
Fidelity European Trust PLC | 28.8% | 54.1% | 0.68% | Europe |
JPMorgan Global Growth | 45.5% | 68.0% | 0.39% | Global Equity Income |
*Source AJ Bell correct as at 31/05/2026
Performance figures are retrieved from FE FundInfo on a Total Return basis.
Best-selling Investment Trusts from Fidelity
Investment Trust | 3 year performance | 5 year performance | OCF | Sector |
Scottish Mortgage | 132.0% | 30.2% | 0.31% | Global |
Polar Capital Technology Ord | 222.0% | 222.0% | 0.77% | Technology & Technology Innovati |
Fidelity European Trust | 28.8% | 54.1% | 0.68% | Europe |
Seraphim Space Investment Trust Ord | 573.9% | N/A | 1.77%* | Growth Capital |
Schroder Japan Trust | 97.6% | 121.5% | 1.14% | Japan |
Allianz Technology Trust | 185.2% | 168.4% | 0.62% | Technology & Technology Innovati |
Schroder Oriental Income Fund | 97.0% | 92.2% | 0.90% | Asia Pacific Equity Income |
International Public Partnership | 15.4% | 2.1% | 1.09% | Infrastructure |
City of London | 58.2% | 78.1% | 0.36% | UK Equity Income |
JPMorgan Global Growth & Income Ord | 45.5% | 68.0% | 0.39% | Global Equity Income |
*Source: Fidelity correct as at 31/05/2026
Performance figures are retrieved from FE FundInfo on a Total Return basis.
Best-selling Investment Trusts from Hargreaves Lansdown
Investment Trust | 3 year performance | 5 year performance | OCF | Sector |
Scottish Mortgage | 132.0% | 30.2% | 0.31% | Global |
Polar Capital Technology Trust plc ORD | 222.0% | 222.0% | 0.77% | Technology & Technology Innovati |
Seraphim Space Investment Trust plc ORD | 573.9% | N/A | 1.79%* | Growth Capital |
City of London | 58.2% | 78.1% | 0.36% | UK Equity Income |
F&C Investment Trust | 59.4% | 71.0% | 0.45% | Global |
Alliance Witan plc Ordinary | 42.1% | 50.8% | 0.62% | Global |
3i Group PL | 24.6% | 110.9% | 0.67% | Private Equity |
Greencoat UK Wind | -16.9% | 3.9% | 1.03% | Renewable Energy Infrastructure |
Allianz Technology Trust | 185.2% | 168.4% | 0.62% | Technology & Technology Innovati |
JPMorgan Global Growth & Income Ord | 45.5% | 68.0% | 0.39% | Global Equity Income |
*Source Hargreaves Lansdown 31/05/2026
Performance figures are retrieved from FE FundInfo on a Total Return basis.
Best-selling Investment Trusts from interactive investor
Investment Trust | 3 year performance | 5 year performance | OCF | Sector |
Scottish Mortgage Ord | 132.0% | 30.2% | 0.31% | Global |
Polar Capital Technology Ord | 222.0% | 222.0% | 0.77% | ITTechnology & Technology Innovati |
Seraphim Space Investment Trust plc | 573.9% | N/A | 1.78%* | Growth Capital |
3i Group Ord | 24.6% | 110.9% | 0.67% | Private Equity |
Greencoat UK Wind | -16.9% | 3.9% | 1.03% | Renewable Energy Infrastructure |
City of London | 58.2% | 78.1% | 0.36% | UK Equity Income |
| 185.2% | 168.4% | 0.62% | Technology & Technology Innovation |
| 45.5% | 68.0% | 0.39% | Global Equity Income |
F&C Investment Trust | 59.4% | 71.0% | 0.45% | Global |
Henderson Far East Income | 50.0% | 33.0% | 1.09% | Asia Pacific Equity Income |
Performance figures are retrieved from FE FundInfo on a Total Return basis.
Data provided by FE FundInfo, correct as at 31 May 2026.
Best-selling ETFs | May 2026
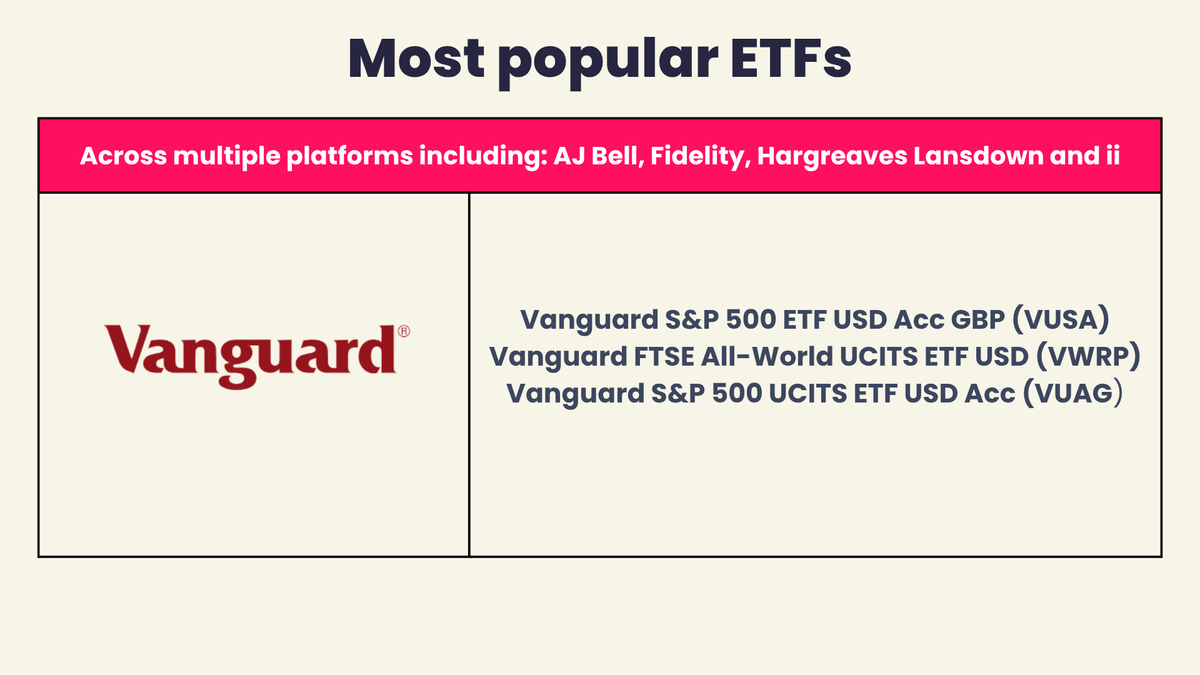
The most popular ETFs across AJ Bell, Fidelity, Hargreaves Lansdown, and interactive investor were Vanguard FTSE All-World UCITS ETF USD (VWRP), Vanguard S&P 500 UCITS ETF USD Acc (VUAG), and Vanguard S&P 500 ETF USD Acc GBP (VUSA).

Best-selling ETFs from AJ Bell
ETF | 3 year performance | 5 year performance | OCF | Sector |
Vanguard FTSE All-World ETF USD Acc GBP (VWRP) | 67.9% | 81.0% | 0.19% | Equity - International |
Vanguard Funds PLC VANGUARD S&P 500 UCITS ETF (VUAG) | 72.3% | 101.6% | 0.07% | Equity - USA |
Shares Physical Gold ETC GBP (SGLN) | 112.0% | 150.1% | 0.12% | Commodity & Energy |
Vanguard S&P 500 UCITS ETF GBP (VUSA) | 72.4% | 101.7% | 0.07% | Equity - USA |
Vaneck Ucits Etfs PLC VANECK SEMICONDUCTOR UCITS ETF (SMGB) | 273.2% | 393.1% | 0.35% | Equity - Tech Media & Telec |
Vanguard FTSE All-World UCITS ETF GBP (VWRL) | 68.1% | 81.2% | 0.19% | Equity - International |
iShares Physical Silver ETC GBP (SSLN) | 197.9% | 185.6% | 0.20% | Commodity & Energy |
Invesco EQQQ NASDAQ-100 ETF GBP (EQQQ) | 97.7% | 137.5% | 0.30% | Equity - Tech Media & Telec |
Invesco Markets Ii PLC IVZ FTSE WLD UCITS ETF ACC (FWRG) | N/A | N/A | 0.15% | Equity - International |
Ishares Iv PLC ISHARES MSCI GLOBAL SEMIC UCITS USD ACC (SEMI) | 271.6% | N/A | 0.35% | Equity - Tech Media & Telec |
Performance figures are retrieved from FE FundInfo on a Total Return basis.
Best-selling ETFs from Fidelity
ETF | 3 year performance | 5 year performance | OCF | Sector |
VanEck Semiconductor UCITS ETF (SMGB) | 273.2% | 393.1% | 0.35% | Equity - Tech Media & Telec |
Vanguard FTSE All-World UCITS ETF USD Accumulation (VWRP) | 67.9% | 81.0% | 0.19% | Equity - International |
Vanguard S&P 500 UCITS ETF GBP (VUAG) | 72.3% | 101.6% | 0.07% | Equity - USA |
iShares S&P 500 Information Technology Sector UCITS ETF GBP in GB (iiTU) | 128.0% | 213.7% | 0.15% | Equity - Tech Media & Telec |
iShares Physical Silver ETC (SSLN) | 197.9% | 185.6% | 0.20% | Commodity & Energy |
iShares Physical Gold ETC (SGLN) | 112.0% | 150.1% | 0.12% | Commodity & Energy |
Vanguard S&P 500 UCITS ETF CHF TR in GB (VUSA) | 72.4% | 101.7% | 0.07% | Gbl ETF Equity - USA |
VanEck Space Innovators UCITS ETF A USD Acc (JEDG) | 422.5% | N/A | 0.55% | Equity - Other Specialist |
Invesco EQQQ NASDAQ-100 ETF GBP (EQQQ) | 97.7% | 137.5% | 0.30% | Equity - Tech Media & Telec |
Amundi Smart Overnight Return GBP Hedged UCITS ETF Acc (CSH2) | 15.8% | 19.6% | 0.10% | Currency - Euro |
Performance figures are retrieved from FE FundInfo on a Total Return basis.
Best-selling ETFs from Hargreaves Lansdown
ETF | 3 year performance | 5 year performance | OCF | Sector |
Vanguard FTSE All-World UCITS ETF USD (VWRP) | 67.9% | 81.0% | 0.19% | Equity - International |
Vanguard S&P 500 UCITS ETF USD Acc (VUAG) | 72.3% | 101.6% | 0.07% | Gbl ETF Equity - USA |
VanEck Semiconductor UCITS ETF (SMGB) | 273.2% | 393.1% | 0.35% | Equity - Tech Media & Telec |
Invesco Markets II Plc FTSE All-World UCITS ETF USD Accumulation (FWRG) | N/A | N/A | 0.15% | Equity - International |
iShares IV plc MSCI Global Semiconductors UCITS ETF USD Acc (SEMI) | 271.6% | N/A | 0.35% | Equity - Tech Media & Telec |
Vanguard S&P 500 UCITS ETF USD(GBP) (VUSA) | 72.4% | 101.7% | 0.07% | Equity - USA |
VanEck UCITS ETFs plc Space Innovators UCITS ETF A USD Acc (JEDG) | N/A | N/A | 0.55% | Equity - Other Specialist |
iShares Physical Gold ETC (SGLN) | 112.0% | 150.1% | 0.12% | Commodity & Energy |
Invesco EQQQ NASDAQ-100 ETF GBP (EQQQ) | 97.7% | 137.5% | 0.30% | Equity - Tech Media & Telec |
Vanguard FTSE All-World UCITS ETF GBP (VWRL) | 68.1% | 81.2% | 0.19% | Equity - International |
Performance figures are retrieved from FE FundInfo on a Total Return basis.
Best-selling ETFs from interactive investor
ETF | 3 year performance | 5 year performance | OCF | Sector |
Vanguard FTSE All-World UCITS ETF USD (VWRP) | 67.9% | 81.0% | 0.19% | Equity - International |
VanEck Semiconductor UCITS ETF (SMGB) | 273.2% | 393.1% | 0.35% | Equity - Tech Media & Telec |
Vanguard S&P 500 UCITS ETF USD Acc (VUAG) | 72.3% | 101.6% | 0.07% | Gbl ETFEquity - USA |
iShares Physical Gold ETC (SGLN) | 112.0% | 150.1% | 0.12% | Commodity & Energy |
iShares Physical Silver ETC (SSLN) | 197.9% | 185.6% | 0.20% | Commodity & Energy |
Vanguard S&P 500 UCITS ETF USD(GBP) (VUSA) | 72.4% | 101.7% | 0.07% | Equity - USA |
Vanguard FTSE All-World UCITS ETF GBP (VWRL) | 68.1% | 81.2% | 0.19% | Gbl ETF Equity - International |
iShares Core MSCI World UCITS ETF Acc USD in GB (SWDA) | 66.7% | 85.3% | 0.20% | Equity - International |
WisdomTree NASDAQ 100 3x Daily Leveraged GBP (LQQ3) | 335.8% | 247.0% | 0.75% | Equity - USA |
VanEck Space Innovators ETF A USD Acc GBP (JEDG) | 422.5% | N/A | 0.55% | Equity - Other Specialist |
Performance figures are retrieved from FE FundInfo on a Total Return basis.
Data provided by FE FundInfo, correct as at 31 May 2026.
---
[1] S&P 500
[2] Google Finance
[3] Yahoo Finance
[4] MSCI Emerging Markets Latin America Index (USD)
[5] MarketWatch