



Best-selling funds, Investment Trusts and ETFs of June 2026
Discover the most popular investments on the UK's top platforms
Written by Boring Money
8 July, 2026
Every month, Boring Money conducts rigorous research on what the best-selling investments were across the UK's major investment platforms - including AJ Bell, Fidelity, Hargreaves Lansdown and interactive investor.
Boring Money's expert analysis
It was a rocky month for global stock markets, even as the conflict in Iran appeared to come to a fragile conclusion. The Strait of Hormuz reopened and traffic started to flow. Oil prices dropped quickly, back to levels not seen since February and The return or profit on an investment, usually expressed as a percentage of the total price per year. For example, if the yield on a bond was 5%, this means an investor with £100 in that bond would get £5 in returns per year. started to fall. But investors started to look more closely at the AI phenomenon and worry about its sustainability.
The reopening of the Strait of Hormuz did not bring the triumphalist response from stock markets that might have been expected a few months ago. The oil price dropped to $70 a barrel and policymakers breathed a sigh of relief, thinking that they may get away without raising interest rates. Bond yields dropped as investors slowly took rate rises off the table.
The A global index that tracks large and medium-sized companies from 23 developed countries around the world.was down 0.7% over the month. Some of the US technology giants had an even tougher time – the A stock market index, like the FTSE 100 or S&P 500, that shows how the share prices of seven of the biggest technology companies in the US are performing. fell 8.6% over the month. Even the apparently unstoppable semiconductor trade started to wobble after reaching a peak mid-month. Goldman Sachs prime brokerage data showed hedge funds cut their holdings of semiconductor stocks and equipment makers for the final three weeks of June.
In the end, however, it seems to have been a pull-back rather than the start of something more serious. Some of the semiconductor groups had seen triple digit gains for the year to date. While price rises have been supported by earnings, there were worries that gains had moved ahead of reality. The Korean and Taiwanese markets, which are heavily exposed to the AI infrastructure trade, were particularly volatile over the month.
While all eyes were on the technology sector, other areas were quietly reviving. Of these, healthcare was the most notable. After a long time in the doldrums, investors finally started to reappraise the regulatory and tariff-related risks in the sector. The MSCI World Healthcare index was around 6% ahead of the MSCI World [1]. Financials and industrials were the other main areas of strength over the month, while energy was a particular weak spot as the oil price fell.
UK markets were less exciting, with the Also called “Footsie”, the name for the share index made up of the largest 100 companies by market capitalisation (total value of all shares) listed on the London Stock Exchange. rising just 1.5% over the month [2]. UK Firms outside the FTSE 350, typically in the FTSE SmallCap index, market capitalisation from several hundred million up to around £2bn and A company valued between £2 billion and £10 billion. Its shares sit between those of small‑cap (smaller companies) and large‑cap (big companies), usually offering a mix of growth potential and stability.were marginally lower. The ongoing political turmoil in the UK may have deterred investors. However, a coronation is now more likely than a competition in the race to succeed Keir Starmer. Andy Burnham could be the new Prime Minister by the end of July.
There was better news on UK borrowing. Yields came down in response to the end of the war in Iran. The two year A gilt is a fixed income bond issued by the UK government. They are so named because, historically, the paper certificates used to issue these bonds had a gilt (gilded) edge. The government issues gilts in order to fund public spending. yield dropped from 4.4% at the start of June to 4.1% at the end of the month. Bank of England governor Andrew Bailey said rate cuts were still “off the table”, but a rate rise now looks far less likely.
In the US, inflationary pressures proved more acute, with the US The Personal Consumption Expenditures (PCE) price index is the Federal Reserve's primary measure for inflation in the United States. index rose by 3.8% in the 12 months through April, the largest rise since May 2023. More worrying was that price rises appeared to be spreading from energy prices to other parts of the economy. The US labour market has remained strong, which puts it at greater risk of inflation contagion. The Fed's latest quarterly projections show nine of 19 policymakers anticipate a rate hike by year-end.
Best-selling funds | June 2026
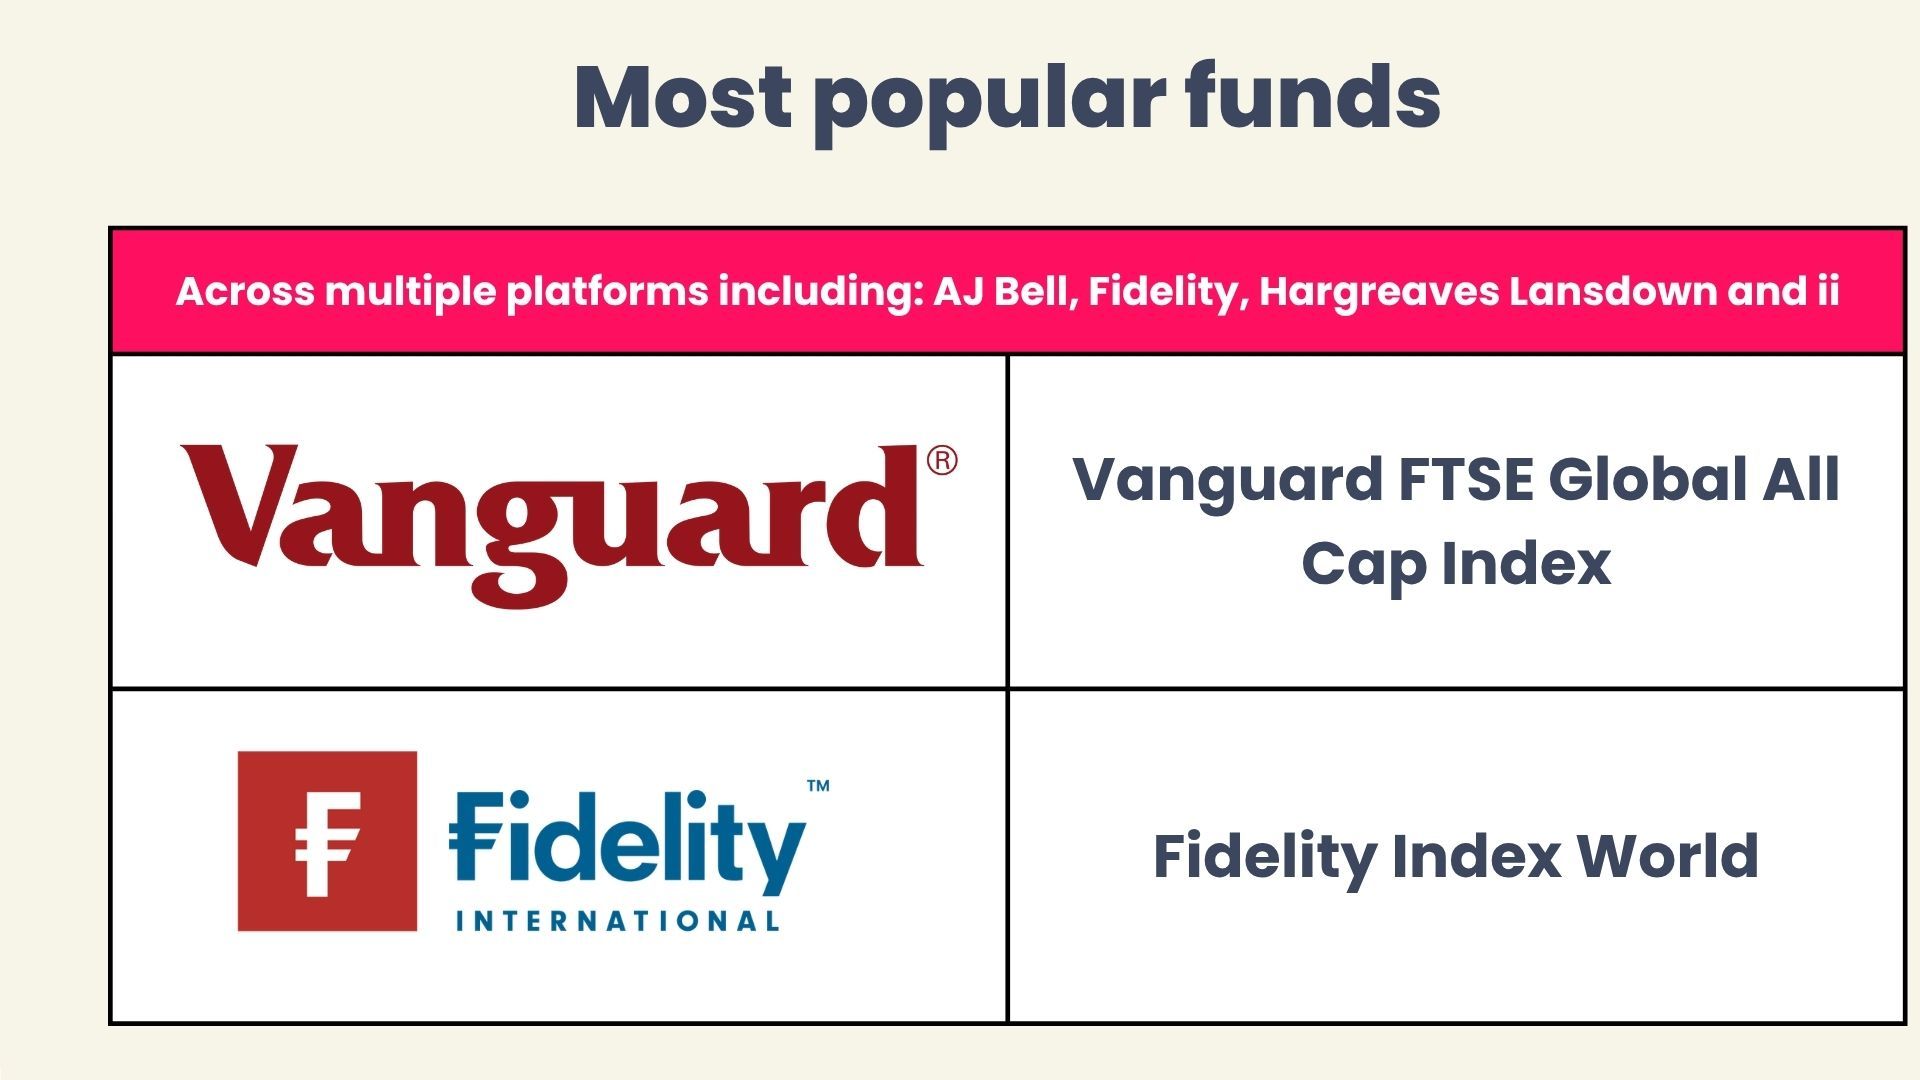
The most popular funds across multiple platforms, including AJ Bell, Fidelity, Hargreaves Lansdown and interactive investor were, Vanguard FTSE Global All Cap Index and Fidelity Index World.
Platform investors reflected the broader market indecision in June, with technology funds sitting alongside cash funds in the top 10 best-sellers on the major platforms. AJ Bell investors still picked the AJ Bell ‘Adventurous’ fund, suggesting there was still some investors with a taste for risk. The Polar Capital Global Technology fund and the Legal & General Global Tech Index were both top choices on the Fidelity platform, while the technology focused WS Blue Whale Growth fund was a best-seller on the ii platform.
However, there was also plenty of evidence of risk aversion. Cash funds (Fidelity Cash and Royal London Short Term Money Market fund) were the top selling funds on the Fidelity and ii platforms. This reflects the broader uncertainty about the When prices are rising or are expected to rise - for example, during a recovery after a recession. The widely accepted point at which it becomes a bull market is when a large proportion of share prices rise 20% or more.and whether the AI stocks that have powered it can maintain momentum.
Elsewhere, the Vanguard FTSE Global All Cap Index and Fidelity Index World funds were the only funds to appear on all four platforms. Both funds remain highly weighted towards the Also known as the Mag 7, a group of seven major technology companies which have dominated the US stock market in recent years. The group comprises: Alphabet, Amazon, Apple, Meta, Microsoft, Nvidia, and Tesla.stocks of Nvidia, Microsoft, Amazon, Apple, Meta, Tesla and Alphabet. This part of the market has had a difficult time more recently, underperforming the An index that tracks the performance of the 500 largest publicly traded companies in the United States. It's often used as a benchmark for the overall global stock market.since the start of the year. AI infrastructure companies such as the semiconductor names have taken up market leadership.
As with last month, the other popular active fund was the Artemis Global Income. This was the only active fund outside technology that made any of the top selling lists. Early signs that emerging markets were finding favour with investors once again were not evident this month. Emerging markets have been volatile, with the Korean and Taiwanese markets particularly lively.
Best-selling funds from AJ Bell
Fund | 3 year performance | 5 year performance | OCF | Sector |
AJ Bell Adventurous I Acc | 56.0% | 67.5% | 0.31% | Flexible Investment |
AJ Bell Moderately Adv I Acc | 46.4% | 52.1% | 0.31% | Flexible Investment |
AJ Bell Global Growth I Acc | 57.0% | 64.0% | 0.31% | Flexible Investment |
Vanguard FTSE Global All Cp Idx £ Acc | 62.4% | 71.2% | 0.23% | Global |
HSBC FTSE All-World Index C Acc | 64.9% | 76.6% | 0.13% | Global |
AJ Bell Balanced I ACC | 38.3% | 41.1% | 0.31% | Flexible Investment |
Fidelity Index World P Acc | 62.5% | 80.0% | 0.12% | Global |
Vanguard LifeStrategy 100% Equity A Acc | 62.0% | 73.6% | 0.20% | Global |
L&G Global Technology Index I Acc | 129.9% | 165.9% | 0.31% | Flexible Investment |
AJ Bell Responsible Scrn Gr I GBP Acc | 45.3% | 42.8% | 0.45% | Flexible Investment |
Performance figures are retrieved from FE FundInfo on a Total Return is a comprehensive way of measuring investment performance that includes two components: capital appreciation/depreciation (changes in the actual price or value of the investment) and income distributions (any dividends, interest payments, or other distributions paid out during the measurement period)..
Best-selling funds from Fidelity
Fund | 3 year performance | 5 year performance | OCF | Sector |
Fidelity Cash Fund | Acc | 14.8% | 18.5% | 0.15% | Short Term Money Market |
Fidelity Index World Fund | 62.5% | 80.0% | 0.12% | Global |
Royal London Short Term Money Market Fund Acc | 15.1% | 19.1% | 0.10% | Volatility Managed |
Vanguard FTSE Glbl All Cap Idx GBP Acc | 62.4% | 71.2% | 0.23% | Global |
Legal & General Global Tech Index I Acc | 129.9% | 165.9% | 0.31% | Flexible Investment |
Artemis Global Income Fund Class | 147.2% | 161.0% | 0.83% | Global Equity Income |
Polar Capital Global Tech I Inc GBP | 270.7% | 248.0% | 1.06% | Technology Innovation |
Fidelity Funds - Global Technology Fund W-Acc-GBP | 79.2% | 99.4% | 1.04% | Technology Innovation |
Legal & General Glbl Equity Index I Acc | 68.2% | 84.1% | 0.13% | Global |
Fidelity Index US Fund P-Acc | 66.3% | 92.4% | 0.06% | North America |
Performance figures are retrieved from FE FundInfo on a Total Return is a comprehensive way of measuring investment performance that includes two components: capital appreciation/depreciation (changes in the actual price or value of the investment) and income distributions (any dividends, interest payments, or other distributions paid out during the measurement period)..
Best-selling funds from Hargreaves Lansdown
Fund | 3 year performance | 5 year performance | OCF | Sector |
HL Growth Fund | 53.4% | N/A | 0.10% | Volatility Managed |
Vanguard FTSE Global All Cap Index | 62.4% | 71.2% | 0.23% | Global |
HL Adventurous Managed | 52.9% | N/A | 0.87% | Volatility Managed |
HL Multi-Index Moderately Adventurous (Class D) | N/A | N/A | 0.87% | Volatility Managed |
L&G International Index Trust C Acc in GB | 68.9% | 84.9% | 0.08% | Global |
Fidelity Index World | 62.5% | 80.0% | 0.12% | Global |
UBS S&P 500 Index | 66.6% | 92.4% | 0.09% | North America |
HL Moderately Adventurous Managed | 44.5% | N/A | 0.88% | Volatility Managed |
Artemis Global Income | 147.2% | 161.0% | 0.83% | Equity Income |
Legal & General US Index | 67.5% | 89.0% | 0.10% | Volatility Managed |
Performance figures are retrieved from FE FundInfo on a Total Return is a comprehensive way of measuring investment performance that includes two components: capital appreciation/depreciation (changes in the actual price or value of the investment) and income distributions (any dividends, interest payments, or other distributions paid out during the measurement period)..
Best-selling funds from interactive investor
Fund | 3 year performance | 5 year performance | OCF | Sector |
Royal London Short Term Money Market (Acc) | 15.1% | 19.1% | 0.10% | Volatility Managed |
Vanguard FTSE Global All Cp Idx £ Acc | 62.4% | 71.2% | 0.23% | Global |
HSBC FTSE All-World Index C Acc | 64.9% | 76.6% | 0.13% | Global |
Artemis Global Income I Acc | 147.2% | 161.0% | 0.83% | Global Equity Income |
Vanguard LifeStrategy 80% Equity | 50.2% | 52.7% | 0.20% | Global |
L&G Global Technology Index Trust | 129.9% | 165.9% | 0.31% | Flexible Investment |
Vanguard LifeStrategy 100% Equity A Acc | 62.0% | 73.6% | 0.20% | Global |
Fidelity Index World | 62.5% | 80.0% | 0.12% | Global |
Vanguard Life Strategy 60% Equity A Acc | 39.1% | 34.2% | 0.20% | Global |
WS Blue Whale Growth R Sterling Acc | 169.7% | 143.8% | 1.05% | Global |
Performance figures are retrieved from FE FundInfo on a Total Return is a comprehensive way of measuring investment performance that includes two components: capital appreciation/depreciation (changes in the actual price or value of the investment) and income distributions (any dividends, interest payments, or other distributions paid out during the measurement period)..
Data provided by FE FundInfo, correct as at 30 June 2026.
Best-selling Investment Trusts | June 2026
The most popular Investment Trusts across AJ Bell, Fidelity, Hargreaves Lansdown, and interactive investor were Scottish Mortgage, Polar Capital Technology Trust and Seraphim Space Investment Trust.
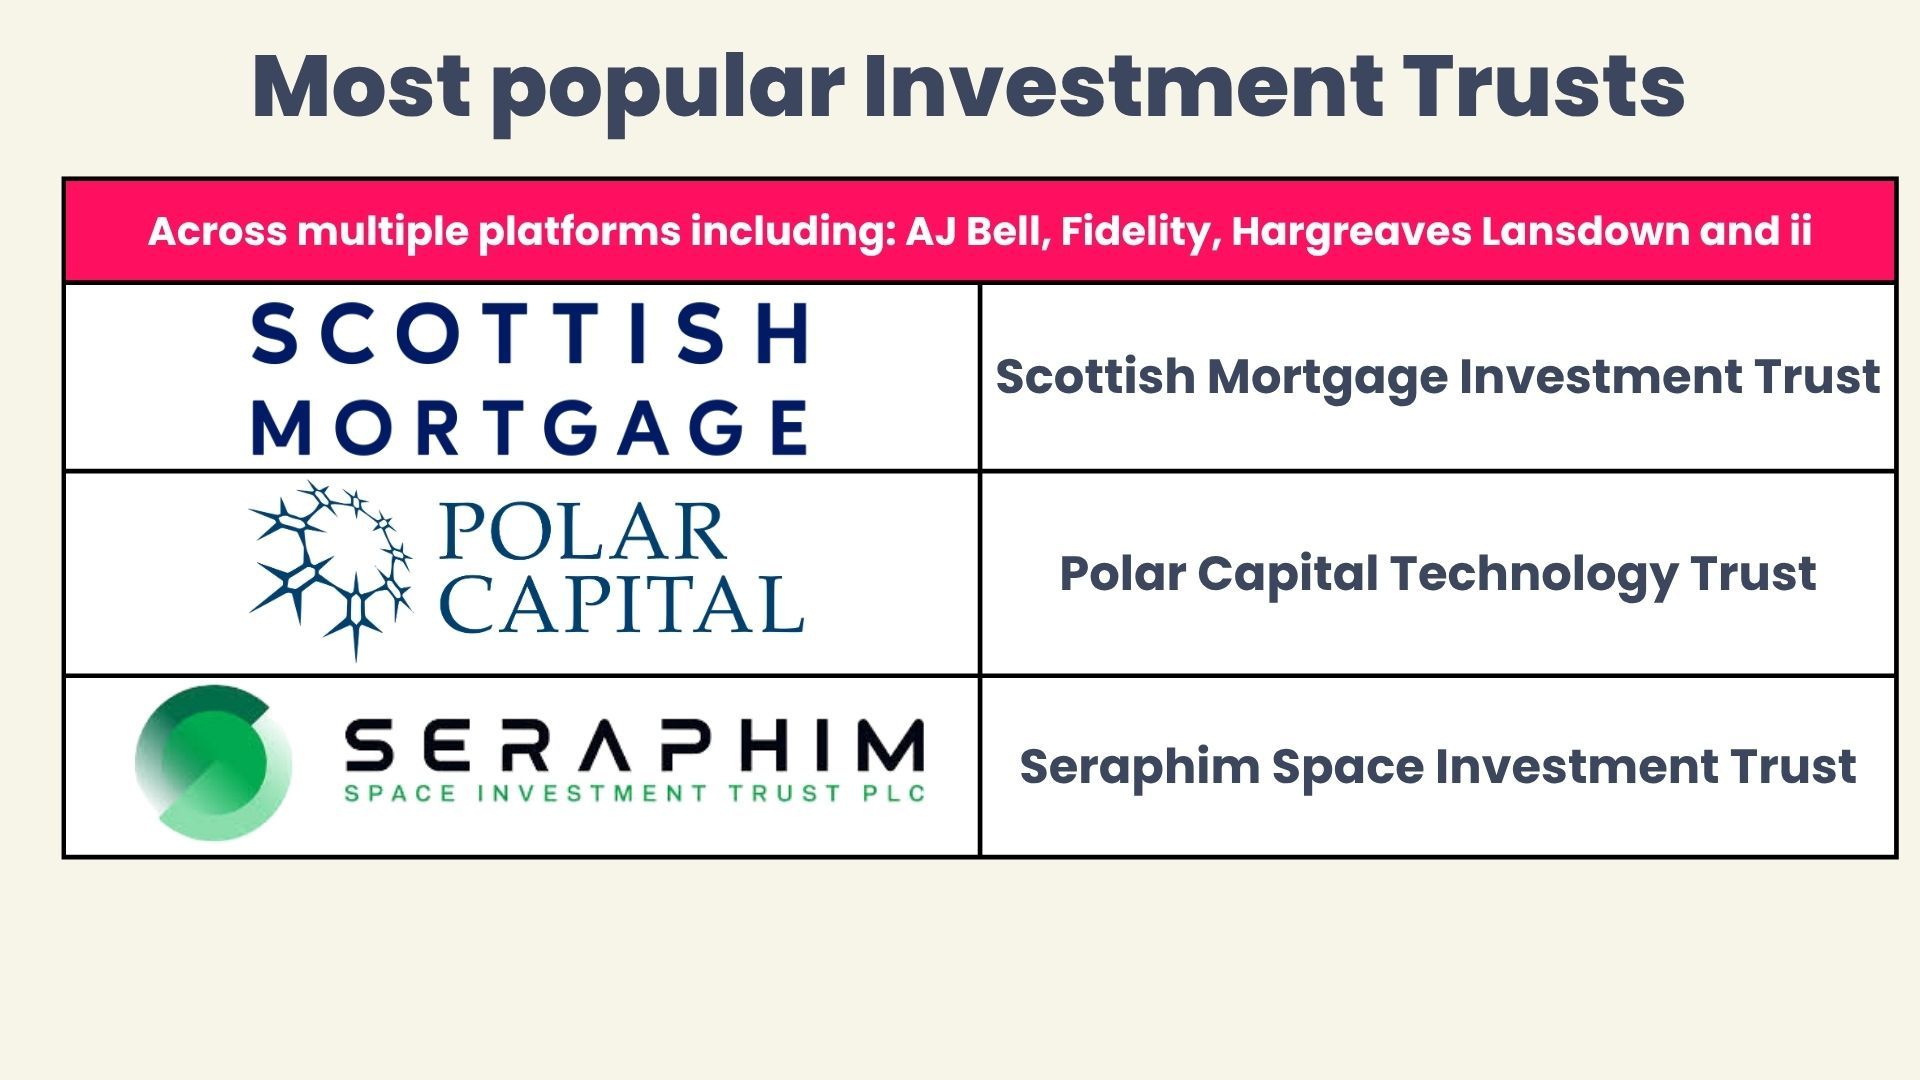
The potential for investing in space captured investors’ imagination this month as SpaceX launched itsWhen shares in a private company are listed on a stock exchange and made available for investors to purchase for the first time.. Scottish Mortgage has been a major investor in SpaceX since its launch as a private company in 2002. It reaped the benefits as the company went public at a valuation of over $2 trillion. The managers will be hoping Anthropic can pull off a similar trick in its upcoming IPO.
The excitement around SpaceX also fed into popularity for the £459m Seraphim Space Investment Trust, which was a best seller on all four platforms for the second month in a row. The Trust invests in private companies that are exploiting the opportunities in satellite technology. It recently launched a £350m ‘C’ class offer to existing shareholders to capitalise on the ‘space boom’.
Conventional technology trusts were also popular. Polar Capital Technology was a best-seller on all four platforms and the Allianz Technology trust appeared on all platforms except AJ Bell. Nevertheless, the steady-eddie options of City of London and JPMorgan Global Growth & Income continued their long-term run of popularity.
Emerging markets proved more popular among Investment Trust investors than among fund or ETF investors. However, their choices tended to be at the lower risk end. Henderson Far East Income appeared on all but the Fidelity platform. It has a yield of 9.5%, but is less exposed to technology than some of its peers. Schroder Oriental Income was also a popular choice.
Edinburgh Worldwide Trust appeared on the Fidelity platform. The Trust has been in a long-running tussle with activist investor Saba Capital, who replaced the board earlier this year. Nevertheless, the trust continues to be managed by Baillie Gifford and has seen an astonishing run of performance over the past 12 months, rising 68%.
Best-selling Investment Trusts from AJ Bell
Investment Trust | 3 year performance | 5 year performance | OCF | Sector |
Scottish Mortgage Ord | 123.1% | 12.8% | 0.33% | Global |
City of London Ord | 60.3% | 79.7% | 0.36% | UK Global Equity Income |
JPMorgan Global Growth & Income Ord | 43.0% | 66.5% | 0.39% | Global Equity Income |
Greencoat UK Wind | -11.2% | 12.1% | 0.83% | Renewable Energy Infrastructure |
Polar Capital Technology Ord | 223.4% | 201.1% | 0.77% | Technology & Technology Innovation |
BlackRock World Mining Trust Ord | 69.3% | 89.0% | 0.95% | Commodities & Natural Resources |
Seraphim Space Investment Trust Ord | 595.6% | N/A | 1.80%* | Growth Capital |
Henderson Far East Income | 48.0% | 29.9% | 1.12% | Asia Pacific Equity Income |
Fidelity Special Values | 78.6% | 68.7% | 0.68% | UK All Companies |
TwentyFour Select Monthly Income | 30.9% | 14.9% | 1.21% | IT Debt - Loans & Bonds |
*Source: AJ Bell correct as of 30/06/2026
Performance figures are retrieved from FE FundInfo on a Total Return is a comprehensive way of measuring investment performance that includes two components: capital appreciation/depreciation (changes in the actual price or value of the investment) and income distributions (any dividends, interest payments, or other distributions paid out during the measurement period)..
Best-selling Investment Trusts from Fidelity
Investment Trust | 3 year performance | 5 year performance | OCF | Sector |
Scottish Mortgage | 123.1% | 12.8% | 0.33% | Global |
Polar Capital Technology Trust PLC | 223.4% | 201.1% | 0.77% | Technology & Technology Innovation |
Seraphim Space Investment Trust Ord | 595.6% | N/A | 1.77%* | Growth Capital |
Allianz Technology Trust | 187.0% | 155.4% | 0.62% | Technology & Technology Innovation |
Fidelity Special Values PLC | 78.6% | 68.7% | 0.68% | UK All Companies |
Edinburgh Worldwide | 106.0% | -18.9% | 0.76% | Global Smaller Companies |
Schroder Japan Trust | 92.4% | 118.4% | 1.14% | Japan |
Baillie Gifford US Growth | 116.2% | -5.5% | 0.72% | North America |
International Public Partnership | 27.8% | 9.1% | 1.09% | Global Infrastructure |
Schroder Oriental Income Fund LTD | 99.0% | 100.2% | 0.90% | Asia Pacific Equity Income |
*Source: Fidelity correct as of 30/06/2026
Performance figures are retrieved from FE FundInfo on a Total Return is a comprehensive way of measuring investment performance that includes two components: capital appreciation/depreciation (changes in the actual price or value of the investment) and income distributions (any dividends, interest payments, or other distributions paid out during the measurement period)..
Best-selling Investment Trusts from Hargreaves Lansdown
Investment Trust | 3 year performance | 5 year performance | OCF | Sector |
Scottish Mortgage | 123.1% | 12.8% | 0.33% | Global |
Polar Capital Technology Trust plc ORD | 223.4% | 201.1% | 0.77% | Technology & Technology Innovation |
Seraphim Space Investment Trust plc ORD | 595.6% | N/A | 1.79%* | Growth Capital |
F&C Investment Trust | 67.2% | 77.9% | 0.45% | Global |
City of London | 60.3% | 79.7% | 0.36% | UK Equity Income |
Alliance Witan plc Ordinary | 41.8% | 50.8% | 0.47% | Global |
Henderson Far East Income | 48.0% | 29.9% | 1.12% | Asia Pacific Equity Income |
Greencoat UK Wind | -11.2% | 12.1% | 0.83% | Renewable Energy Infrastructure |
JPMorgan Global Growth & Income Ord | 43.0% | 66.5% | 0.39% | Global Equity Income |
Allianz Technology Trust PLC | 187.0% | 155.4% | 0.62% | Technology & Technology Innovation |
*Source: Hargreaves Lansdown as of 30/06/2026
Performance figures are retrieved from FE FundInfo on a Total Return is a comprehensive way of measuring investment performance that includes two components: capital appreciation/depreciation (changes in the actual price or value of the investment) and income distributions (any dividends, interest payments, or other distributions paid out during the measurement period)..
Best-selling Investment Trusts from interactive investor
Investment Trust | 3 year performance | 5 year performance | OCF | Sector |
Scottish Mortgage | 123.1% | 12.8% | 0.33% | Global |
Polar Capital Technology | 223.4% | 201.1% | 0.77% | Technology & Technology Innovation |
Seraphim Space Investment Trust plc | 595.6% | N/A | N/A | Growth Capital |
Greencoat UK Wind | -11.2% | 12.1% | 0.83% | Renewable Energy Infrastructure |
Henderson Far East Income | 48.0% | 29.9% | 1.12% | Asia Pacific Equity Income |
City of London | 60.3% | 79.7% | 0.36% | UK Equity Income |
F&C Investment Trust | 67.2% | 77.9% | 0.45% | Global |
3I Group PLC | 34.5% | 140.1% | 0.67% | Private Equity |
| 187.0% | 155.4% | 0.62% | Technology & Technology Innovation |
| 43.0% | 66.5% | 0.39% | Global Equity Income |
Performance figures are retrieved from FE FundInfo on a Total Return is a comprehensive way of measuring investment performance that includes two components: capital appreciation/depreciation (changes in the actual price or value of the investment) and income distributions (any dividends, interest payments, or other distributions paid out during the measurement period)..
Data provided by FE FundInfo, correct as of 30 June 2026.
Best-selling ETFs | June 2026
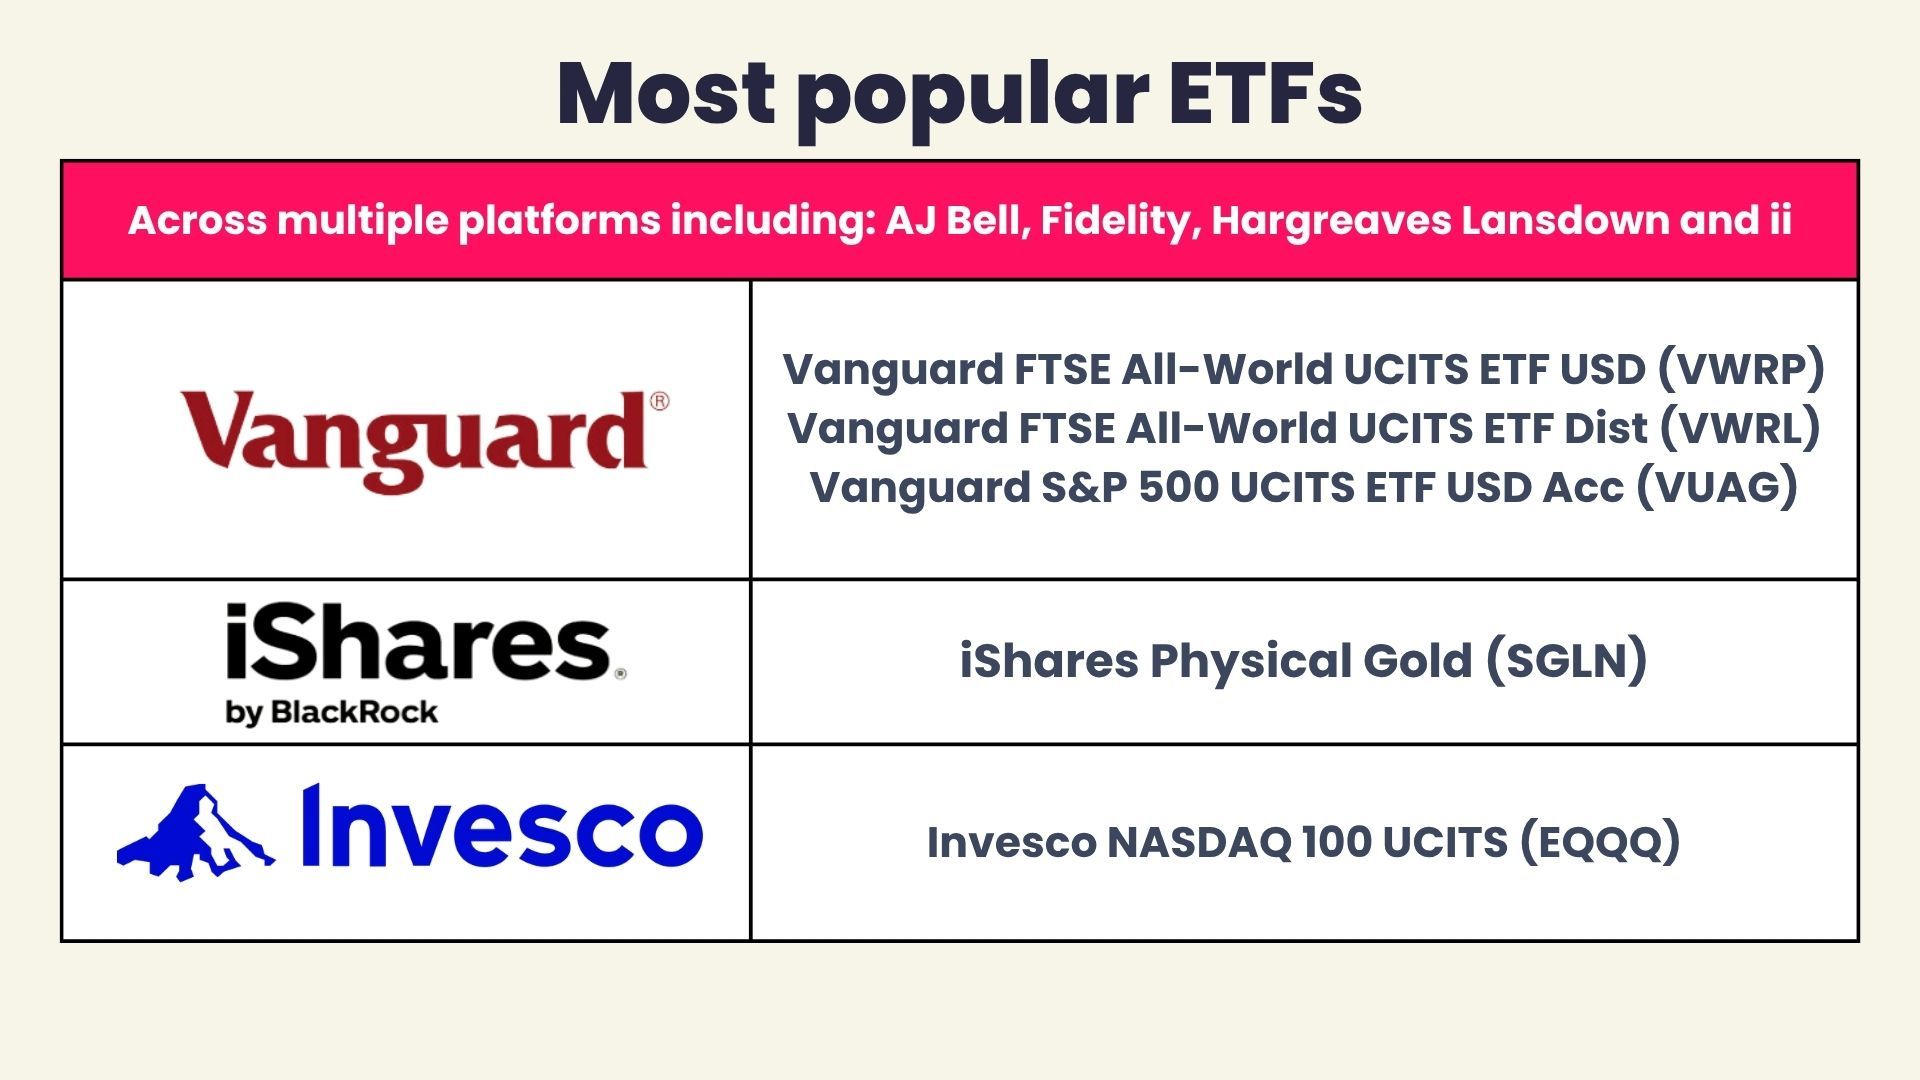
The most popular ETFs across AJ Bell, Fidelity, Hargreaves Lansdown, and interactive investor were Vanguard FTSE All-World UCITS ETF USD (VWRP), Vanguard FTSE All-World UCITS ETF Dist (VWRL), Vanguard S&P 500 UCITS ETF USD Acc (VUAG), iShares Physical Gold ETC (SGLN) and Invesco NASDAQ 100 UCITS (EQQQ).
The momentum trades of semiconductors and space exploration were in evidence among A type of fund made up of a number of assets which can be bought and sold on the stock market, in the same way as you would with individual shares. investors in June. In spite of the wobbles in the semiconductor trade in the latter half of the month, the VanEck Semiconductor UCITS ETF was the best-selling ETF on the Fidelity platform, with investors hoping it can replicate the 320% gain it has seen over the past three years in future. Semiconductor specialist ETFs were also popular on the Hargreaves Lansdown platform. VanEck Space Innovators ETF is attracting investor attention.
Broader technology ETFs were also popular. The Invesco EQQQ NASDAQ-100 ETF appeared on all four platforms, with the iShares S&P 500 Information Technology Sector UCITS ETF also popular. Nasdaq was one of the first index providers to include SpaceX, and it joined as one of the largest stocks in the index.
The iShares Physical Gold ETC appeared on all four platforms, in spite of a difficult run for gold. The gold price has been steadily falling since late February, slipping from $5,200 per ounce to its current level of $4,100. The Iran crisis hit prices hard because it raised interest rate expectations. Gold tends to struggle when real interest rates are high: it doesn’t pay an income so the opportunity cost of holding it is higher. There were some signs of a recovery after the reopening of the Strait of Hormuz.
S&P 500-focused ETFs remained popular across all platforms. Investors showed a preference for the Dollar version, as the US currency continued its rebound. The two other notable additions were the iShares Global Infrastructure UCITS ETF, State Street SPDR MSCI World Value UCITS ETF and iShares plc Core MSCI Emerging Markets IMI UCITS ETF. This suggests that canny investors were looking for diversification options away from the US AI trade.


Investing? We do that, too
Scottish Widows helps you invest in a Stocks and Shares ISA simply and easily from the start. With a broad range of shares, funds and ETFs, you can build an investment approach that reflects your goals and how hands‑on you prefer to be.
Want an easier start? The Quicklist offers you a shortlist of options to help refine your choices. Need full control or expert‑managed portfolios? You’ll discover flexible options, transparent costs and useful tools that keep you in control throughout your journey.
Whatever your ambitions, we offer you the choice and clarity to invest with confidence.
Investing involves risk.
Discover more
Best-selling ETFs from AJ Bell
ETF | 3 year performance | 5 year performance | OCF | Sector |
Vanguard FTSE All-World ETF USD Acc GBP (VWRP) | 64.1% | 75.1% | 0.19% | Equity - International |
Vanguard S&P 500 ETF USD Acc GBP (VUAG) | 66.8% | 92.6% | 0.07% | Equity - USA |
iShares Physical Gold ETC GBP (SGLN) | 101.0% | 136.2% | 0.12% | Commodity & Energy |
Vanguard S&P 500 UCITS ETF GBP (VUSA) | 67.0% | 92.9% | 0.07% | Equity - USA |
Vaneck Ucits Etfs PLC VANECK SEMICONDUCTOR UCITS ETF (SMGB) | 319.9% | 424.1% | 0.35% | Equity - Tech Media & Telec |
Vanguard FTSE All-World UCITS ETF GBP (VWRL) | 64.5% | 75.5% | 0.19% | Equity - International |
Invesco EQQQ NASDAQ-100 ETF GBP (EQQQ) | 93.0% | 120.6% | 0.30% | Equity - Tech Media & Telec |
Invesco Markets Ii PLC IVZ FTSE WLD UCITS ETF ACC (FWRG) | N/A | N/A | 0.15% | Equity - International |
iShares Physical Silver ETC GBP (SSLN) | 149.1% | 135.2% | 0.21% | Commodity & Energy |
Ishares Iv PLC ISHARES MSCI GLOBAL SEMIC UCITS USD ACC (SEMI) | 311.3% | N/A | 0.35% | Equity - Tech Media & Telec |
Performance figures are retrieved from FE FundInfo on a Total Return is a comprehensive way of measuring investment performance that includes two components: capital appreciation/depreciation (changes in the actual price or value of the investment) and income distributions (any dividends, interest payments, or other distributions paid out during the measurement period)..
Best-selling ETFs from Fidelity
ETF | 3 year performance | 5 year performance | OCF | Sector |
VanEck Semiconductor UCITS ETF (SMGB) | 319.9% | 424.1% | 0.35% | Equity - Tech Media & Telec |
Vanguard FTSE All-World UCITS ETF USD Accumulation (VWRP) | 64.1% | 75.1% | 0.19% | Equity - International |
Vanguard S&P 500 UCITS ETF GBP (VUAG) | 66.8% | 92.6% | 0.07% | Equity - USA |
Invesco EQQQ NASDAQ-100 ETF GBP (EQQQ) | 93.0% | 120.6% | 0.30% | Tech Media & Telec |
iShares Physical Gold ETC (SGLN) | 101.0% | 136.2% | 0.12% | Commodity & Energy |
iShares S&P 500 Information Technology Sector UCITS ETF GBP in GB (iiTU) | 115.3% | 181.0% | 0.15% | Tech Media & Telec |
Amundi Smart Overnight Return GBP Hedged UCITS ETF Acc (CSH2) | 15.7% | 20.0% | 0.10% | Currency - Euro |
Vanguard FTSE All-World UCITS ETF (VWRL) | 64.5% | 75.5% | 0.19% | Equity - International |
iShares Global Infrastructure UCITS ETF USD (Dist) (INFR) | 32.8% | 43.3% | 0.65% | Equity - Other Specialist |
State Street SPDR MSCI World Value UCITS ETF (VALW) | 74.4% | 96.7% | 0.25% | Equity - International |
Performance figures are retrieved from FE FundInfo on a Total Return is a comprehensive way of measuring investment performance that includes two components: capital appreciation/depreciation (changes in the actual price or value of the investment) and income distributions (any dividends, interest payments, or other distributions paid out during the measurement period)..
Best-selling ETFs from Hargreaves Lansdown
ETF | 3 year performance | 5 year performance | OCF | Sector |
Vanguard FTSE All-World UCITS ETF USD (VWRP) | 64.1% | 75.1% | 0.19% | Equity - International |
Vanguard S&P 500 UCITS ETF USD Acc (VUAG) | 66.8% | 92.6% | 0.07% | Equity - USA |
Invesco Markets II Plc FTSE All-World UCITS ETF USD Accumulation (FWRG) | N/A | N/A | 0.15% | Equity - International |
VanEck Semiconductor UCITS ETF (SMGB) | 319.9% | 424.1% | 0.35% | Equity - Tech Media & Telec |
Vanguard S&P 500 UCITS ETF USD(GBP) (VUSA) | 67.0% | 92.9% | 0.07% | Equity - USA |
iShares IV plc MSCI Global Semiconductors UCITS ETF USD Acc (SEMI) | 311.3% | N/A | 0.35% | Equity - Tech Media & Telec |
iShares Physical Metals plc Physical Gold ETC (SGLN) | 101.0% | 136.2% | 0.12% | Commodity & Energy |
Invesco Markets III PLC EQQQ NASDAQ 100 UCITS ETF (EQQQ) | 93.0% | 120.6% | 0.30% | Equity - Tech Media & Telec |
Vanguard FTSE All-World UCITS ETF GBP (VWRL) | 64.5% | 75.5% | 0.19% | Equity - International |
iShares plc Core MSCI Emerging Markets IMI UCITS ETF Acc (EMIM) | N/A | N/A | 0.55% | Equity - Other Specialist |
Performance figures are retrieved from FE FundInfo on a Total Return is a comprehensive way of measuring investment performance that includes two components: capital appreciation/depreciation (changes in the actual price or value of the investment) and income distributions (any dividends, interest payments, or other distributions paid out during the measurement period)..
Best-selling ETFs from interactive investor
ETF | 3 year performance | 5 year performance | OCF | Sector |
Vanguard FTSE All-World UCITS ETF USD (VWRP) | 64.1% | 75.1% | 0.19% | Equity - International |
Invesco NASDAQ 100 UCITS (EQQQ) | 93.0% | 120.6% | 0.30% | Equity - Tech Media & Telec |
Vanguard S&P 500 UCITS ETF USD Acc (VUAG) | 66.8% | 92.6% | 0.07% | Equity - USA |
iShares Physical Gold ETC (SGLN) | 101.0% | 136.2% | 0.12% | Commodity & Energy |
iShares Physical Silver ETC (SSLN) | 149.1% | 135.2% | 0.21% | Commodity & Energy |
Vanguard S&P 500 UCITS ETF USD(GBP) (VUSA) | 67.0% | 92.9% | 0.07% | Equity - USA |
Vanguard FTSE All-World UCITS ETF GBP (VWRL) | 64.5% | 75.5% | 0.19% | Equity - International |
Ishares Iv PLC ISHARES MSCI GLOBAL SEMIC UCITS USD ACC (SEMI) | 311.3% | N/A | 0.35% | Equity - Tech Media & Telec |
Invesco FTSE All-World ETF Acc (FWRA) | N/A | N/A | 0.15% | Equity - International |
VanEck Space Innovators ETF A USD Acc GBP (JEDG) | 422.5% | N/A | 0.55% | Equity - Other Specialist |
Performance figures are retrieved from FE FundInfo on a Total Return is a comprehensive way of measuring investment performance that includes two components: capital appreciation/depreciation (changes in the actual price or value of the investment) and income distributions (any dividends, interest payments, or other distributions paid out during the measurement period)..
Data provided by FE FundInfo, correct as of 30 June 2026.
---
[1] MSCI World Healthcare Index
[2] MarketWatch