Best-selling funds, investment trusts and ETFs of August 2023
Discover the most-bought investments on the major platforms
By Boring Money
13 Sep, 2023
What were the best-selling funds, investment trusts and ETFs of August 2023? Every month, Boring Money conducts rigorous research on what the best-selling investments were across the UK's major investment platforms - including AJ Bell, Fidelity, Hargreaves Lansdown and interactive investor. We crunch the numbers for you and collate them in the handy tables below. Scroll down for the full results and read the expert insights from our Founder & CEO into what investors have been up to in the last month.
Boring Money's expert analysis
August remained a tricky time for investors as nerves remain about potential future recessions, and the short-term power of cash remains compelling. When interest rates are 5.25%, the so-called ‘risk premium’ we expect from investing gets higher and fewer investors are convinced it’s worth it.
There are also very few pockets of perceived opportunity, meaning investors are playing it relatively safe, avoiding big sector or regional bets and backing large, diversified global funds.
Best-selling funds of August 2023
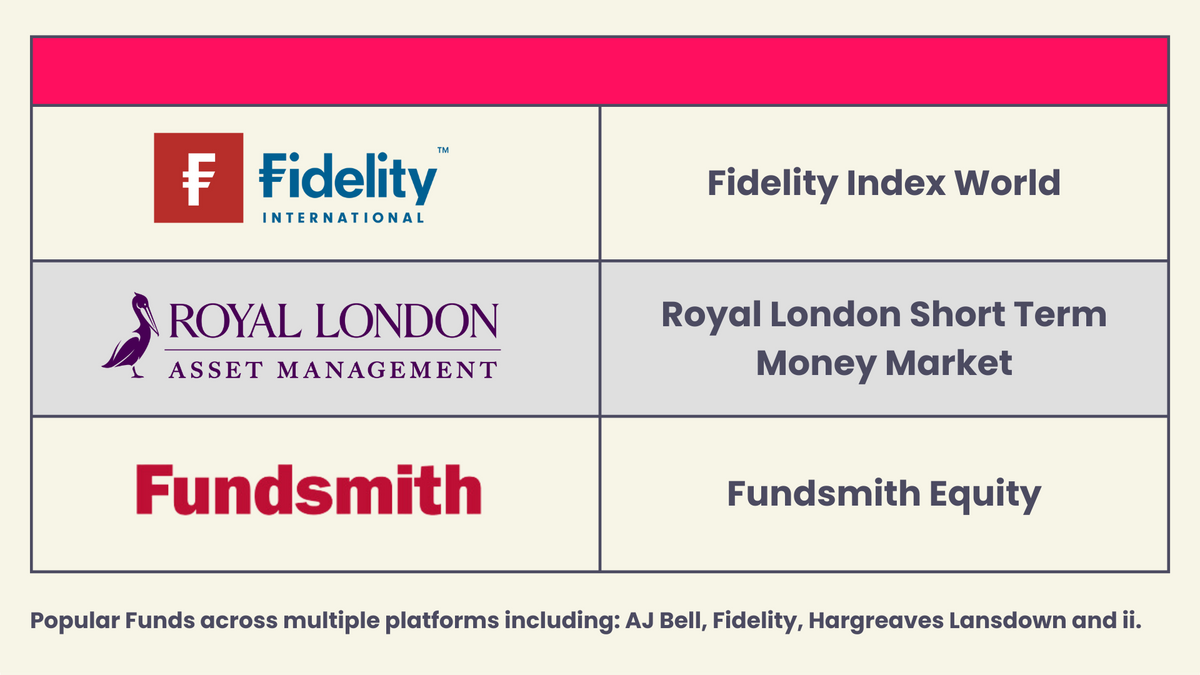
The three most popular funds across multiple platforms including AJ Bell, Fidelity, Hargreaves Lansdown and interactive investor were Fidelity Index World, Royal London Short Term Money Market and Fundsmith Equity.

Once again in August we saw investors piling into the relative haven of short-term money market funds. Royal London’s fund is a perennially popular option, with abrdn’s Sterling Money Market fund making it to the bestsellers on Hargreaves Lansdown.
Huge passive fund producer Legal and General is also taking in money, as investors embrace its cash trust but also its low-cost Global Technology Index fund. With an Ongoing Charge Figure of just 0.32%, and featuring investor darling Nvidia as its third largest pick making up over 7% of this fund, it’s a low-cost way to access a large global basket of tech stocks.
Finally Terry Smith continues to do no wrong in the eyes of investors and Fundsmith keeps its spot in the investors’ Hit Parade.
Best-selling funds from AJ Bell
Funds | 3 year performance | 5 year performance | Ongoing Charges Figure |
AJ Bell Adventurous | 27.85% | 36.13% | 0.31% |
AJ Bell Moderately Adventurous | 19.97% | 28.28% | 0.31% |
AJ Bell Global Growth | 27.86% | 35.39% | 0.31% |
AJ Bell Balanced | 14.23% | 24.28% | 0.31% |
Fidelity Index World | 34.81% | 54.01% | 0.12% |
Fundsmith Equity | 19.94% | 54.27% | 0.94% |
Vanguard LifeStrategy 100% Equity | 30.44% | 39.16% | 0.22% |
AJ Bell Responsible | N/A | N/A | 0.45% |
Vanguard LifeStrategy 80% Equity | 18.88% | 28.65% | 0.22% |
Vanguard FTSE Global All Cap | 29.01% | 43.81% | 0.23% |
Best-selling funds from Fidelity
Funds | 3 year performance | 5 year performance | Ongoing Charges Figure |
Fidelity Index World | 34.81% | 54.01% | 0.12% |
Fidelity Cash Fund | 4.02% | 5.22% | 0.15% |
Royal London Short Term Money Market | 4.34% | 5.63% | 0.10% |
Fidelity Funds - Global Technology | 51.40% | 131.36% | 1.04% |
Legal & General Cash Trust - Income | 4.07% | 5.24% | 0.15% |
Legal & General Global Technology Index | 44.33% | 125.04% | 0.32% |
Legal & General Cash Trust | 4.07% | 5.24% | 0.15% |
Fidelity Index US Fund | 41.30% | 71.34% | 0.06% |
Rathbone Global Opportunities | 13.64% | 48.03% | 0.51% |
Fundsmith Equity | 19.94% | 54.27% | 0.94% |
Best-selling funds from Hargreaves Lansdown (in alphabetical order)
Funds | 3 year performance | 5 year performance | Ongoing Charges Figure |
abrdn Sterling Money Market | 4.37% | 5.81% | 0.15% |
Fidelity Index World | 34.81% | 54.01% | 0.12% |
Jupiter India | 78.58% | 43.11% | 0.69% |
Legal & General Cash Trust | 4.07% | 5.24% | 0.15% |
Legal & General International Index Trust | 34.07% | 54.03% | 0.08% |
Legal & General US Index | 38.68% | 70.21% | 0.05% |
Premier Miton UK Money Market | 4.37% | 5.62% | 0.26% |
Royal London Global Equity Select | 71.47% | 97.39% | 0.71% |
Royal London Short Term Money Market | 4.34% | 5.63% | 0.10% |
UBS S&P 500 Index | 40.46% | 70.89% | 0.09% |
Best-selling funds from interactive investor
Funds | 3 year performance | 5 year performance | Ongoing Charges Figure |
Fundsmith Equity | 19.94% | 54.27% | 0.94% |
Royal London Short Term Money Market | 4.34% | 5.63% | 0.10% |
Vanguard LifeStrategy 80% Equity | 18.88% | 28.65% | 0.22% |
Legal & General Global Technology Index | 44.33% | 125.04% | 0.32% |
Vanguard LifeStrategy 100% Equity | 30.44% | 39.16% | 0.22% |
Vanguard FTSE Global All Cap | 29.01% | 43.81% | 0.23% |
Vanguard US Equity Index | 37.38% | 63.43% | 0.10% |
Vanguard FTSE Developed World Ex UK | 33.20% | 54.11% | 0.14% |
HSBC FTSE All-World Index | 30.77% | 48.37% | 0.13% |
Legal & General Global 100 Index | 43.25% | 77.69% | 0.14% |
Performance has been calculated in accordance with end-of-day market prices on 31/08/2023.
Best-selling investment trusts of August 2023
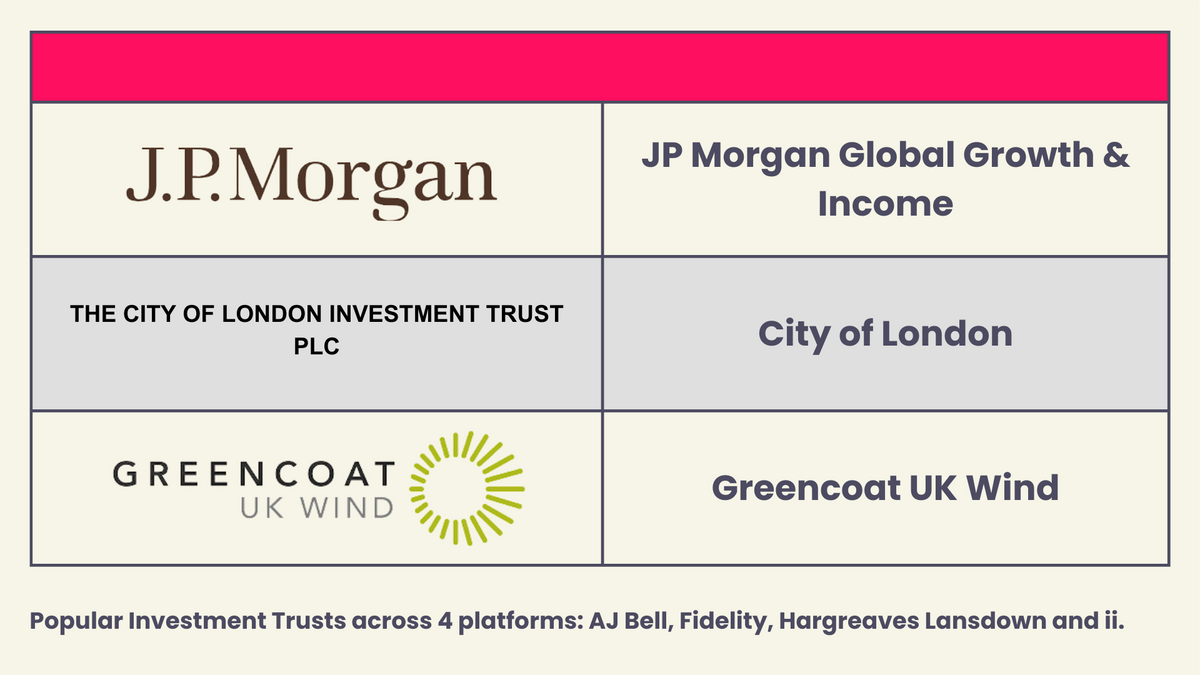
The three most popular investment trusts across AJ Bell, Fidelity, Hargreaves Lansdown and interactive investor were JP Morgan Global Growth & Income, City of London and Greencoat UK Wind.

Despite – or maybe because of – a 3-year loss of -28%, Scottish Mortgage is a bestseller for August, featuring in the top 10 trusts on 3 major platforms.
Looking at the 3 trusts which feature on 4 major platforms, there is a more specific sector pick in the form of Greencoat UK Wind, which is up nearly 50% over the last 5 years. JP Morgan’s Global Growth and Income Trust is also remaining popular. With a dividend yield of nearly 4%, as the name suggests it offers investors an income stream, and has also gone up in value by about 12% over the last year.
If you look under the bonnet here, there are a lot of tech stocks lurking – Microsoft, Amazon, Nvidia, Meta, etc – so it's worth investors checking that they're as diversified as the names of their funds and/or trusts suggest.
City of London is an example of one such trust which will offer up quite a different suite of investments. Think old school – with holdings such as Unilever, Shell, HSBC and BAE Systems. It won't win any sustainability prizes but the trust is old, esteemed and not into ‘Johnny Come Latelys’ for those who like their investments unfaddy and traditional.
Best-selling investment trusts from AJ Bell
Investment Trusts | 3 year performance | 5 year performance | Ongoing Charges Figure |
Scottish Mortgage | -27.80% | 25.50% | 0.34% |
F&C | 29.49% | 28.35% | 0.59% |
Greencoat UK Wind | 15.72% | 47.32% | 1.03% |
Merchants Trust | 79.06% | 42.86% | 0.59% |
JP Morgan Global Growth & Income | 49.90% | 74.09% | 0.53% |
City Of London | 41.36% | 19.37% | 0.45% |
Murray International | 54.10% | 42.45% | 0.59% |
TR Property | -10.46% | -18.46% | 0.70% |
Henderson Far East Income | -10.28% | -10.93% | 1.09% |
Caledonia Investments | 36.88% | 27.17% | 1.00% |
Best-selling investment trusts from Fidelity
Investment Trusts | 3 year performance | 5 year performance | Ongoing Charges Figure |
Scottish Mortgage | -27.80% | 25.50% | 0.34% |
City of London | 41.36% | 19.37% | 0.45% |
Greencoat UK Wind | 15.72% | 47.32% | 1.03% |
JP Morgan Global Growth & Income | 49.90% | 74.09% | 0.53% |
Fidelity European Trust | 41.65% | 69.60% | 0.78% |
3i Infrastructure | 16.16% | 46.20% | 1.16% |
Henderson Far East Income | -10.28% | -10.93% | 1.09% |
F&C | 29.49% | 28.35% | 0.59% |
BlackRock World Mining | 69.95% | 119.23% | 0.99% |
Fidelity China Special Situations | -30.43% | 3.34% | 1.18% |
Best-selling investment trusts from Hargreaves Lansdown (in alphabetical order)
Investment Trusts | 3 year performance | 5 year performance | Ongoing Charges Figure |
Alliance Trust | 36.20% | 49.51% | 0.64% |
Brunner | 47.29% | 54.15% | 0.61% |
City of London | 41.36% | 19.37% | 0.45% |
Greencoat UK Wind | 15.72% | 47.32% | 1.03% |
India Capital Growth | 130.21% | 63.20% | 1.62% |
JP Morgan Global Growth & Income | 49.90% | 74.09% | 0.53% |
Pershing Square Holdings | 54.22% | 169.36% | 2.66% |
Supermarket Income REIT | -19.22% | -4.44% | 1.37% |
The Renewables Infrastructure Group | -6.36% | 29.32% | 0.88% |
Tritax Eurobox | -30.96% | -36.28% | 1.60% |
Best-selling investment trusts from interactive investor
Investment Trusts | 3 year performance | 5 year performance | Ongoing Charges Figure |
Scottish Mortgage | -27.80% | 25.50% | 0.34% |
Greencoat UK Wind | 15.72% | 47.32% | 1.01% |
City of London | 41.36% | 19.37% | 0.45% |
F&C | 29.49% | 28.35% | 0.59% |
JP Morgan Global Growth & Income | 49.90% | 74.09% | 0.53% |
BlackRock World Mining | 69.95% | 119.23% | 0.99% |
Alliance Trust | 36.20% | 49.51% | 0.64% |
The Renewables Infrastructure Group | -6.36% | 29.32% | 0.88% |
Merchants Trust | 79.06% | 42.86% | 0.59% |
Murray International | 54.10% | 42.45% | 0.59% |
Performance has been calculated in accordance with end-of-day market prices on 31/08/2023.
Best-selling ETFs of August 2023
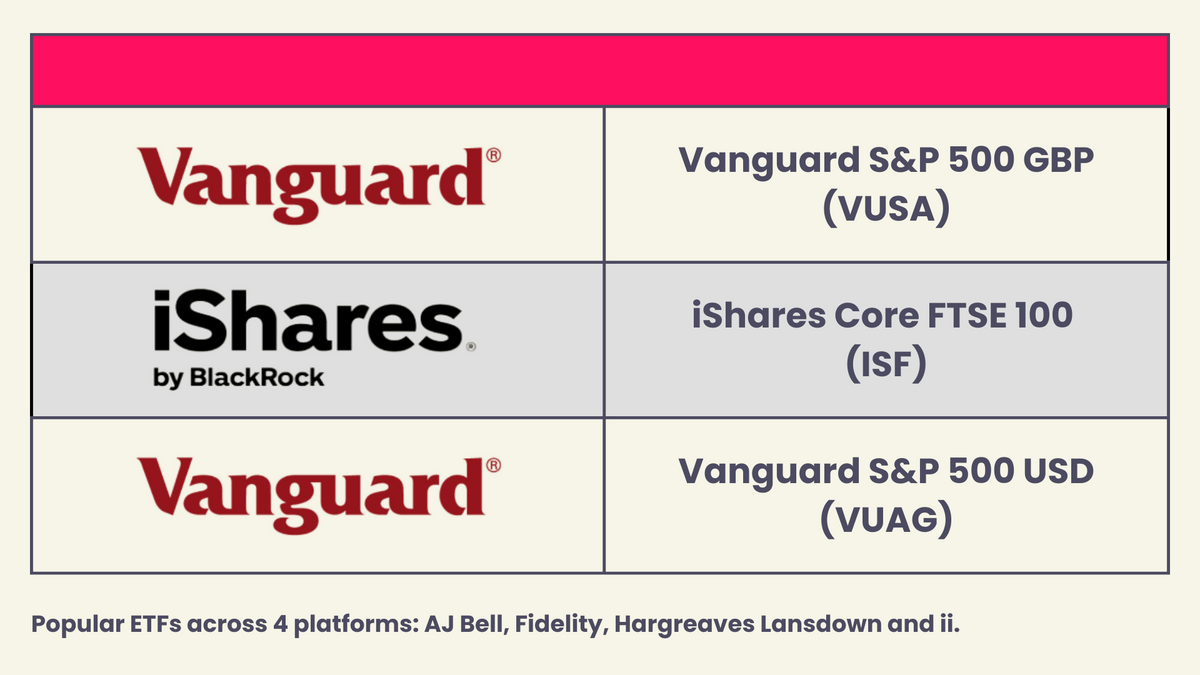
The three most popular ETFs across AJ Bell, Fidelity, Hargreaves Lansdown and interactive investor were Vanguard S&P 500 GBP (VUSA), BlackRock iShares Core FTSE 100 (ISF) and Vanguard S&P 500 USD (VUAG).

ETFs are easy, shortcut ways to invest in a wide range of things from a given region or sector. They're like investment playlists.
Investors’ love affair with the US continued in August and Vanguard’s S&P 500 fund was the most popular with retail investors, who bought this in both a dollar version and a pound version. The GBP option removes currency risk and means any returns will just be down to what happens to those 500 shares in the index – not whether the dollar goes up or down.
Despite lacklustre performance going back years, some are still keeping the faith with the FTSE100. iShares’ Core FTSE100 fund was amongst the bestsellers on all 4 major platforms.
Interestingly, we see more ‘short selling’ funds appear on interactive investor’s lists, telling us there are more investors who are betting on a fall in both the US and UK markets. These leveraged funds are hardcore options which can make a lot of money – but also lose a lot. Not for the faint-hearted.
Best-selling ETFs from AJ Bell
ETFs | 3 year performance | 5 year performance | Ongoing Charges Figure |
Vanguard S&P 500 UCITS ETF (VUSA) | 41.44% | 70.35% | 0.07% |
Vanguard S&P 500 UCITS ETF USD Acc (VUAG) | 41.44% | N/A | 0.07% |
iShares Core FTSE 100 (ISF) | 39.02% | 20.78% | 0.07% |
iShares Core S&P 500 UCITS ETF USD (CSP1) | 40.53% | 71.11% | 0.07% |
Vanguard FTSE All-World UCITS ETF (VWRL) | 30.30% | 46.75% | 0.22% |
HSBC MSCI World UCITS ETF (HMWO) | 34.76% | 54.89% | 0.15% |
iShares Core MSCI World (SWDA) | 34.31% | 53.59% | 0.20% |
Vanguard FTSE All-World UCITS ETF USD (VWRP) | 30.30% | N/A | 0.22% |
Vanguard FTSE 250 UCITS (VMID) | 12.67% | 1.71% | 0.10% |
iShares Physical Gold ETC (SGLN) | 3.98% | 64.27% | 0.12% |
Best-selling ETFs from Fidelity
ETFs | 3 year performance | 5 year performance | Ongoing Charges Figure |
Vanguard S&P 500 UCITS ETF (VUSA) | 41.44% | 70.35% | 0.07% |
iShares Core S&P 500 UCITS ETF USD (CSP1) | 40.53% | 71.11% | 0.07% |
Vanguard S&P 500 UCITS ETF USD Acc (VUAG) | 41.44% | N/A | 0.07% |
Invesco NASDAQ 100 UCITS (EQQQ) | 36.87% | 112.70% | 0.30% |
iShares NASDAQ 100 UCITS ETF USD (CNX1) | 37.42% | 112.29% | 0.33% |
iShares Core FTSE 100 (ISF) | 39.02% | 20.78% | 0.07% |
iShares S&P 500 Information Technology (IITU) | 55.22% | 150.27% | 0.15% |
Vanguard FTSE 100 (VUKE) | 39.01% | 20.60% | 0.09% |
HSBC MSCI World UCITS ETF (HMWO) | 34.76% | 54.89% | 0.15% |
iShares UK Gilts 0-5yr UCITS ETF GBP (IGLS) | -5.69% | -3.10% | 0.07% |
Best-selling ETFs from Hargreaves Lansdown (in alphabetical order)
ETFs | 3 year performance | 5 year performance | Ongoing Charges Figure |
Invesco NASDAQ 100 UCITS (EQQQ) | 36.87% | 112.70% | 0.30% |
iShares Core MSCI World (SWDA) | 39.02% | 20.78% | 0.07% |
iShares Core FTSE 100 (ISF) | 34.31% | 53.59% | 0.20% |
Lyxor Smart Cash (CSH2) | 4.68% | 6.10% | 0.07% |
Vanguard FTSE 100 (VUKE) | 39.01% | 20.60% | 0.09% |
Vanguard FTSE All-World UCITS ETF USD (VWRP) | 30.30% | N/A | 0.22% |
Vanguard S&P 500 UCITS ETF USD Acc (VUAG) | 41.44% | N/A | 0.07% |
Vanguard S&P 500 UCITS ETF GBP (VUSA) | 41.44% | 70.35% | 0.07% |
WisdomTree FTSE 100 3x Daily Leveraged (3UKL) | 90.63% | -14.44% | 2.15% |
WisdomTree S&P 500 VIX Short-Term Futures 2.25x Daily Lev (VILX) | -99.98% | -100.00% | 4.47% |
Best-selling ETFs from interactive investor
ETFs | 3 year performance | 5 year performance | Ongoing Charges Figure |
Vanguard S&P 500 UCITS ETF (VUSA) | 41.44% | 70.35% | 0.07% |
iShares Core FTSE 100 (ISF) | 39.02% | 20.78% | 0.07% |
iShares Core MSCI World (SWDA) | 34.31% | 53.59% | 0.20% |
Vanguard FTSE All-World UCITS ETF (VWRL) | 30.30% | 46.75% | 0.22% |
Vanguard S&P 500 (VUAG) | 41.44% | N/A | 0.07% |
WisdomTree NASDAQ 100 3x Daily Short (LQQS) | -81.96% | -98.28% | 1.60% |
WisdomTree NASDAQ 100 3x Daily Leveraged (LQQ3) | 14.00% | 147.78% | 0.75% |
WisdomTree FTSE 100 3x Daily Leveraged (3UKL) | 90.63% | -14.44% | 2.15% |
Vanguard FTSE 100 (VUKE) | 39.01% | 20.60% | 0.09% |
Lyxor Smart Overnight Return ETF (CSH2) | 4.68% | 6.10% | 0.07% |
Performance has been calculated in accordance with end-of-day market prices on 31/08/2023.


