Best-Selling Funds, Investment Trusts and ETFs of July 2023
Discover the most-bought investments on the major platforms
By Boring Money
31 July, 2023
What were the best-selling funds, investment trusts and ETFs of July 2023? Every month, Boring Money conducts rigorous research on what the best-selling investments were across the UK's major investment platforms - including AJ Bell, Fidelity, Hargreaves Lansdown and Interactive Investor. We crunch the numbers for you and collate them in the handy tables below. Scroll down for the full results and read the expert insights from our research team into what investors have been up to in the last month.
Boring Money's expert analysis
July was a positive month for global equities, with UK, US and European markets all ending in the green. Investors felt more optimistic upon seeing inflation rates drop below forecast and there is growing expectation in the UK that there's light at the end of the tunnel after a long period of sharp interest rate increases.


Best-Selling Funds of July 2023
The most popular fund across AJ Bell, Fidelity, Hargreaves Lansdown and interactive investor was Fidelity Index World.

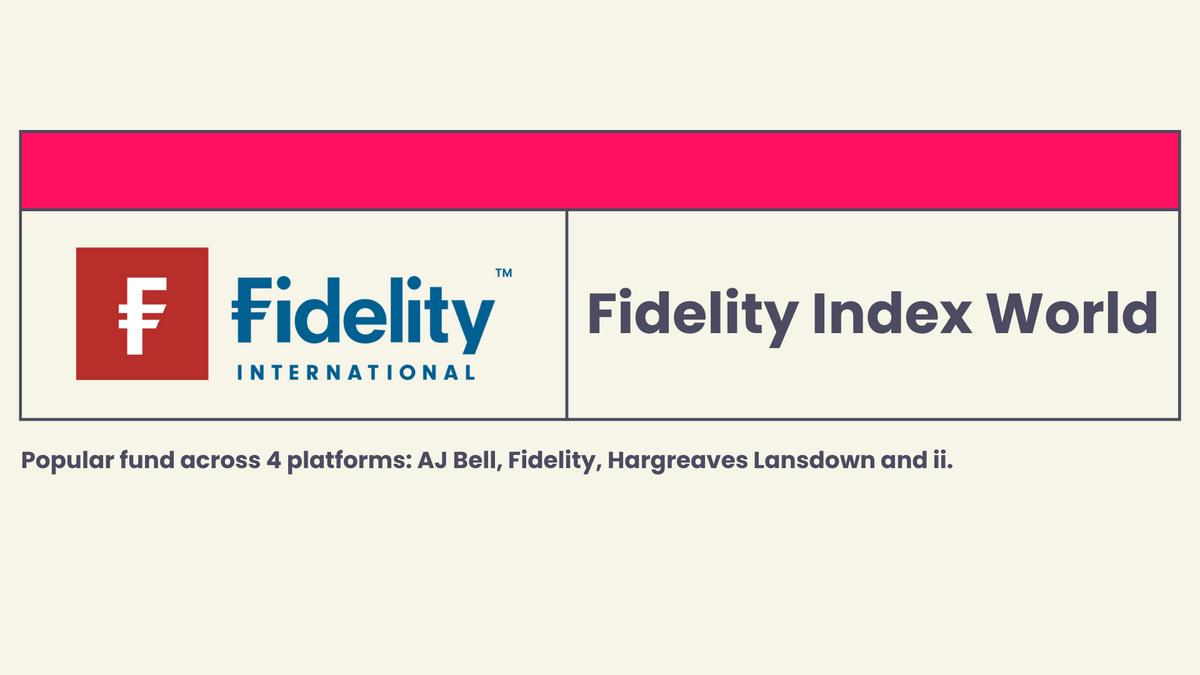
Fidelity Index World and Fundsmith Equity continue to remain popular funds with UK investors. The Fundsmith Equity fund is currently comprised of only 27 different companies. The top 4 holdings include Microsoft, Danish pharmaceutical company Novo Nordisk, as well as French luxury brands L'Oreal and LVMH; all of which returned between 18% - 34% so far this year. Combined, these holdings make up around 30% of the fund and have contributed positively to Fundsmith Equity's YTD performance of 9.4%.
Royal London's Short Term Money Market fund appeared in the best-selling list of 3 out of the 4 providers we track. Money market funds invest in a portfolio of short-term cash deposits and other liquid low-risk instruments - making it a safe place to park some money. Funds like this have become increasingly popular as interest rates have rocketed in 2023, as returns have the potential to exceed the interest earned on money left in the bank.
Best-Selling Funds from AJ Bell
Funds | 3 year performance | 5 year performance | Ongoing Charges Figure |
AJ Bell Adventurous | 34.29% | 38.78% | 0.31% |
AJ Bell Moderately Adventurous | 24.60% | 30.45% | 0.31% |
AJ Bell Global Growth | 35.44% | 38.81% | 0.31% |
AJ Bell Balanced | 17.35% | 26.29% | 0.31% |
Fundsmith Equity | 25.97% | 60.26% | 0.94% |
Fidelity Index World | 41.95% | 59.34% | 0.12% |
AJ Bell Responsible | - | - | 0.45% |
Vanguard LifeStrategy 100% Equity | 38.17% | 42.65% | 0.22% |
Vanguard LifeStrategy 80% Equity | 24.22% | 31.39% | 0.22% |
Vanguard FTSE Global All Cap | 37.00% | 48.37% | 0.23% |
Best-Selling Funds from Fidelity
Funds | 3 year performance | 5 year performance | Ongoing Charges Figure |
Fidelity Cash Fund | 3.56% | 4.81% | 0.15% |
Fidelity Index World | 41.95% | 59.34% | 0.12% |
Royal London Short Term Money Market | 3.80% | 5.15% | 0.10% |
Legal & General Global Tech Index | 58.48% | 142.83% | 0.32% |
Fidelity Funds - Global Tech | 61.50% | 141.93% | 1.04% |
Fundsmith Equity | 25.97% | 60.26% | 0.94% |
Fidelity Index US Fund | 48.72% | 79.62% | 0.06% |
Rathbone Global Opportunities | 20.73% | 58.45% | 0.51% |
abrdn Sterling Money Market | 3.96% | 5.42% | 0.15% |
Fidelity Index UK Fund | 39.53% | 17.67% | 0.06% |
Best-Selling Funds from Hargreaves Lansdown (in alphabetical order)
Funds | 3 year performance | 5 year performance | Ongoing Charges Figure |
abrdn Sterling Money Market | 3.96% | 5.42% | 0.15% |
Fidelity Index World | 41.95% | 59.34% | 0.12% |
Legal & General Cash Trust | 3.59% | 4.81% | 0.15% |
Legal & General Global Technology Index Trust | 59.01% | - | 0.20% |
Legal & General International Index Trust | 42.28% | 58.93% | 0.08% |
Legal & General US Index | 47.69% | 77.56% | 0.05% |
Liontrust Global Technology | 39.45% | 103.95% | 0.87% |
Rathbone Global Opportunities | 20.73% | 58.45% | 0.51% |
Royal London Short Term Money Market | 3.80% | 5.15% | 0.10% |
UBS S&P 500 Index | 48.56% | 78.13% | 0.09% |
Best-Selling Funds from Interactive Investor
Funds | 3 year performance | 5 year performance | Ongoing Charges Figure |
Fundsmith Equity | 25.97% | 60.26% | 0.94% |
Royal London Short Term Money Market | 3.80% | 5.15% | 0.10% |
Vanguard LifeStrategy 80% Equity | 24.22% | 31.39% | 0.22% |
Legal & General Global Technology Index | 58.48% | 142.83% | 0.32% |
Vanguard US Equity Index | 45.87% | 71.42% | 0.10% |
Vanguard LifeStrategy 100% Equity | 38.17% | 42.65% | 0.22% |
Vanguard FTSE Global All Cap | 37.00% | 48.37% | 0.23% |
Fidelity Index World | 41.95% | 59.34% | 0.12% |
Vanguard FTSE Developed World Ex UK | 41.49% | 59.28% | 0.14% |
Legal & General Global 100 Index | 52.73% | 82.58% | 0.14% |
Performance has been calculated in accordance with end-of-day market prices on 31/07/2023.
Best-Selling ETFs of July 2023
The three most popular ETFs across AJ Bell, Fidelity, Hargreaves Lansdown and Interactive Investor were Vanguard S&P 500 GBP (VUSA), iShares Core S&P 500 USD (CSP1) and Vanguard S&P 500 USD (VUAG).

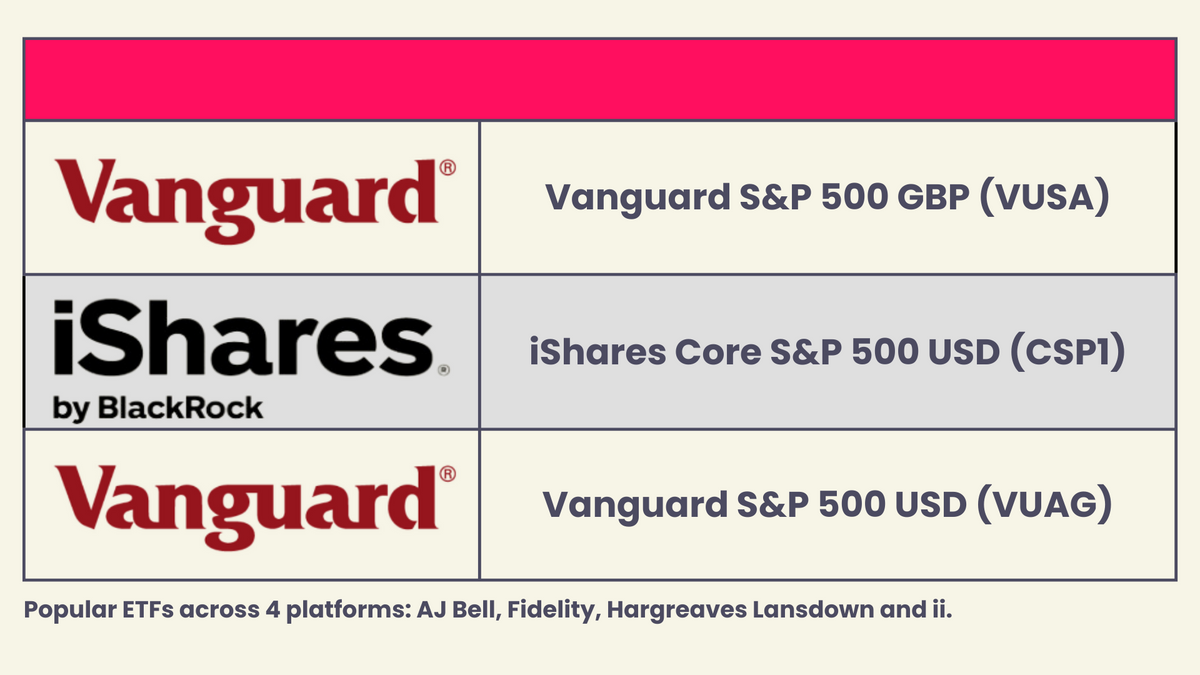
S&P 500 ETFs continue to be at the forefront of retail investors' minds in July. The index has returned close to 17% so far this year, although the vast amount of this has come from the excellent performance of FAANG stocks. This combination of Facebook (Meta), Apple, Amazon, Netflix and Google have become ever-increasing parts of the S&P 500 over recent years, as they have continued to outperform the index. The S&P 500 is often viewed as a proxy of the US economy, which can be problematic given the relatively large influence of a few companies within it. It is important to differentiate between the different components, sectors, and industries of large indices in general - otherwise you may end up a little less diversified than you initially anticipated.
Best-Selling ETFs from AJ Bell
ETFs | 3 year performance | 5 year performance | Ongoing Charges Figure |
Vanguard S&P 500 UCITS ETF (VUSA) | 48.72% | 77.58% | 0.07% |
Vanguard FTSE All-World (VWRL) | 37.34% | 50.99% | 0.22% |
Vanguard FTSE Dev Europe Ex-UK UCITS (VERX) | 34.74% | 36.31% | 0.10% |
Vanguard S&P 500 ETF USD Acc (VUAG) | 48.72% | - | 0.07% |
iShares Core FTSE 100 (ISF) | 45.11% | 19.80% | 0.07% |
iShares Core S&P 500 UCITS ETF USD (CSP1) | 48.72% | 78.42% | 0.07% |
Vanguard FTSE All-World Hi Div Yield UCITS (VHYL) | 43.26% | 33.19% | 0.29% |
iShares Core MSCI World (SWDA) | 42.38% | 58.32% | 0.20% |
Vanguard FTSE 250 UCITS (VMID) | 21.75% | 3.61% | 0.10% |
iShares Physical Gold ETC (SGLN) | 1.90% | 63.13% | 0.12% |
Best-Selling ETFs from Fidelity
ETFs | 3 year performance | 5 year performance | Ongoing Charges Figure |
Vanguard S&P 500 UCITS ETF (VUSA) | 48.72% | 77.58% | 0.07% |
Invesco NASDAQ 100 (EQQQ) | 49.13% | 127.51% | 0.30% |
Vanguard S&P 500 UCITS ETF USD Acc (VUAG) | 48.72% | - | 0.07% |
iShares S&P 500 Information Technology (IITU) | 69.48% | 169.10% | 0.15% |
iShares Core S&P 500 UCITS ETF USD (CSP1) | 48.72% | 78.42% | 0.07% |
Vanguard FTSE All-World (VWRL) | 37.34% | 50.99% | 0.22% |
iShares Core FTSE 100 (ISF) | 45.11% | 19.80% | 0.07% |
Vanguard FTSE All-World UCITS ETF GBP (VWRP) | 37.34% | - | 0.22% |
Vanguard FTSE 100 (VUKE) | 45.06% | 19.61% | 0.09% |
iShares S&P 500 GBP Hedged UCITS ETF (IGUS) | 39.07% | 58.43% | 0.20% |
Best-Selling ETFs from Hargreaves Lansdown (in alphabetical order)
ETFs | 3 year performance | 5 year performance | Ongoing Charges Figure |
HSBC MSCI World UCITS ETF (HMWO) | 42.16% | 58.92% | 0.15% |
Invesco NASDAQ 100 UCITS (EQQQ) | 49.13% | 127.51% | 0.30% |
iShares Core S&P 500 UCITS ETF USD (CSP1) | 48.72% | 78.42% | 0.07% |
Lyxor Smart Cash (CSH2) | 4.23% | 5.70% | 0.07% |
Vanguard FTSE All-World UCITS ETF USD (VWRP) | 37.34% | - | 0.22% |
Vanguard S&P 500 UCITS ETF USD Acc (VUAG) | 48.72% | - | 0.07% |
Vanguard S&P 500 UCITS ETF GBP (VUSA) | 48.72% | 77.58% | 0.07% |
Vanguard USD Treasury Bond UCITS ETF (VUTA) | -13.40% | - | 0.07% |
WisdomTree Brent Crude Oil 3x Daily Short Unhedged (3BSR) | -99.42% | -99.97% | 3.49% |
WisdomTree NASDAQ 100 3x Daily Short (LQQS) | -88.08% | -98.62% | 1.60% |
Best-Selling ETFs from Interactive Investor
ETFs | 3 year performance | 5 year performance | Ongoing Charges Figure |
Vanguard S&P 500 UCITS ETF (VUSA) | 48.72% | 77.58% | 0.07% |
iShares Core FTSE 100 ETF GBP Acc (CUKX) | 45.01% | 19.54% | 0.07% |
Vanguard FTSE All-World UCITS ETF (VWRL) | 37.34% | 50.99% | 0.22% |
iShares Core MSCI World (SWDA) | 42.38% | 58.32% | 0.20% |
Vanguard S&P 500 (VUAG) | 48.72% | - | 0.07% |
Lyxor Smart Overnight Return ETF (CSH2) | 4.23% | 5.70% | 0.07% |
Invesco Nasdaq 100 (EQQQ) | 49.13% | 127.51% | 0.30% |
Vanguard FTSE 100 (VUKE) | 45.06% | 19.61% | 0.09% |
iShares Core S&P 500 UCITS USD (CSP1) | 48.72% | 78.42% | 0.07% |
WisdomTree NASDAQ 100 3x Daily Short (LQQS) | -88.08% | -98.62% | 1.60% |
Performance has been calculated in accordance with end-of-day market prices on 31/07/2023.
Best-Selling Investment Trusts of July 2023
 Sign up for free to read more
Already have an account? Login