Robo performance part 1: high risk portfolios
The latest robo investment performance report to the end of September 2021
15 Oct, 2021
Every investor wants to know that their portfolio is at least achieving par when it comes to investment performance.
Unlike DIY fund pickers, for whom there are tools on most platforms to help filter managers based on past performance, we realised there was no easy way for robo customers to compare their provider to the peer group.
The robos do a lot of the heavy lifting for investors. Offering readymade, diversified portfolios - nice.
But there’s a catch. Because each provider operates a closed ecosystem offering an all-in-one solution on their own platform, it is really hard to compare one with the other.
We wanted to help investors compare, but even our analysts who live and breathe this stuff were finding it tricky using publicly available performance data. So we decided to do something about it.
We set-up test accounts with some of the leading providers and invested our own money so we can see exactly how they perform month by month. Everything here is calculated after charges are deducted too. So you know exactly what you’d actually see in your account once the provider has taken their fee. We're updating these figures four times a year to keep you updated as things change. The data here reflects the latest figures we have up until the end of September.
High risk performance
So, here’s what we found.
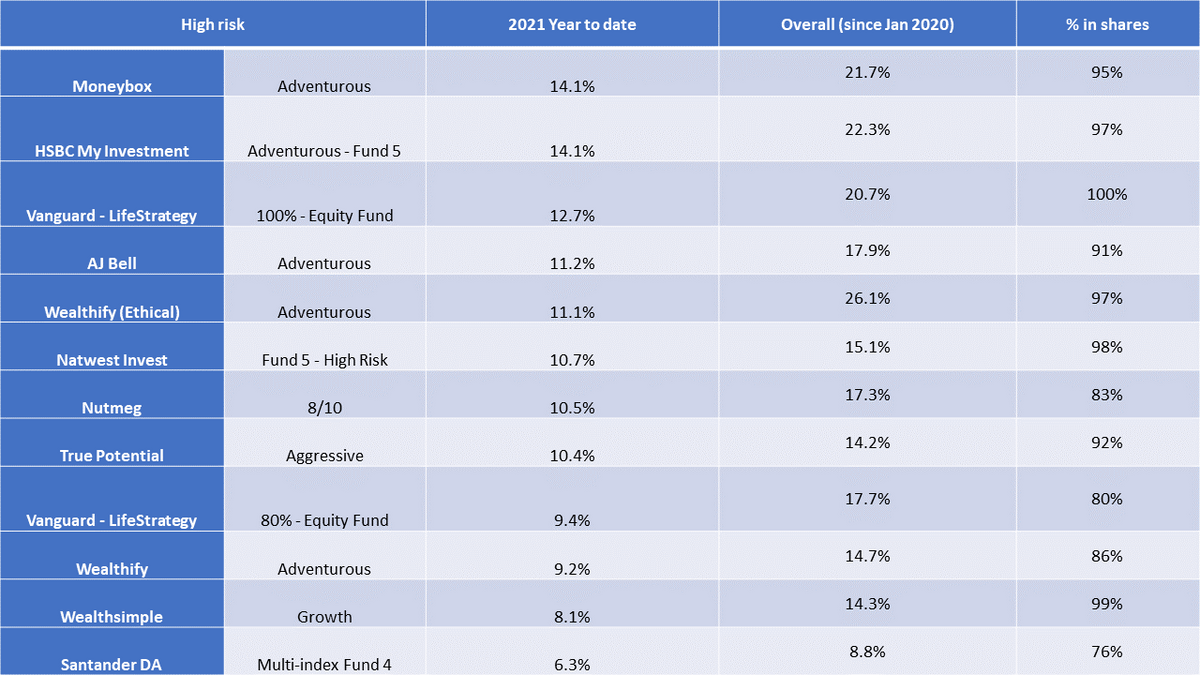
In the high risk category the best performing portfolio for the year so far is Moneybox’s Adventurous portfolio, with a 14.1% return after charges. To put that in real money terms, £1,000 invested as a one-off lump sum at the start of the year would now be worth £1,141.20. Not bad, eh?
HSBC MyInvestment’s Adventurous Fund comes just behind with 14.1%, while Vanguard’s Lifestrategy 100 has delivered 12.7% so far for the year.
Astute observers will note some of these aren’t strictly ‘robo’ providers – we’ve included some portfolios from other platforms and asset managers to help you see a comparison with similar options, since these readymade portfolios on platforms do a similar job of providing an off-the-shelf, diversified investment portfolio.
AJ Bell’s Adventurous option has also done well, while Wealthify’s Ethical portfolio had a knockout quarter, returning 4.15% to take year to date gains to 11.1%.
You can also see Wealthify’s Ethical option is the top performing portfolio since the start of 2020, with a return of 26.1%. Ethical investing enjoyed a strong 2020, and a bumper year means it remains ahead of the pack.
Shares
Clustered at the top of the performance charts, the strongest performers are separated by just a few percentage points. But it is notable that further down the charts, the lowest return in the high risk group is some way behind at 6.3% for the year. That’s almost £80 less than the top performer, based on our £1,000 example above.
When you are comparing robo performance do look at how much each portfolio has in ‘equities’ or shares, though. You should expect the portfolios with more in shares to get you a higher performance over the longer-term. You take some risk, you want some reward.
The Santander portfolio at the foot of the table has significantly less invested in shares. Just 76% is in stocks, compared to 90-100% with most of the other providers*. So actually, if you are after a slightly less hair-raising ride, this could be a better fit your you. What you really don’t want is a portfolio with a very large chunk in shares which is still coming in at the bottom of the tables. That’s like risking a hangover after sticking on the water all night.
The labels you see on portfolios aren’t always as helpful as they might be and don’t assume that every ‘Aggressive’ or ‘Adventurous’ portfolio is the same as the one next to it. There is no standard definition of ‘high risk’ and the % in shares can differ substantially.
Most robos offer at least three or four portfolios, all designed to suit investors with a different attitude to risk. This is a useful guide to help guide your decision, but it is worth doing your homework by lifting the lid on these investments to see exactly what the % in shares is. This table should help and providers should disclose it in their documentation. If you can’t find it, you can always ask them directly and if they aren’t transparent about it then you may want to steer clear.
What next?
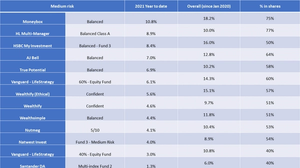
You can also dig a little deeper by taking a look at our compare tables, or check out the latest performance update for the medium risk portfolios here.
You can compare providers and review the ones you use here.
*Note: Santander's portfolio has less than 80% in shares. We include it here because it is the highest risk portfolio in their range of four Multi Index funds. It can allocate up to 90% to shares.