Best performing high risk ready-made solutions of April – June 2023
Which high risk portfolios performed the best?
By Boring Money
20 July, 2023
Every three months we get performance data from the leading ‘ready-made’ investment portfolios made available to retail investors. We group these into three risk categories and take a look at who has performed the best after all fees and charges over various timeframes. In this article, we show you the results for high risk ready-made solutions and explain what's been happening.
Annual high risk returns to June 2023

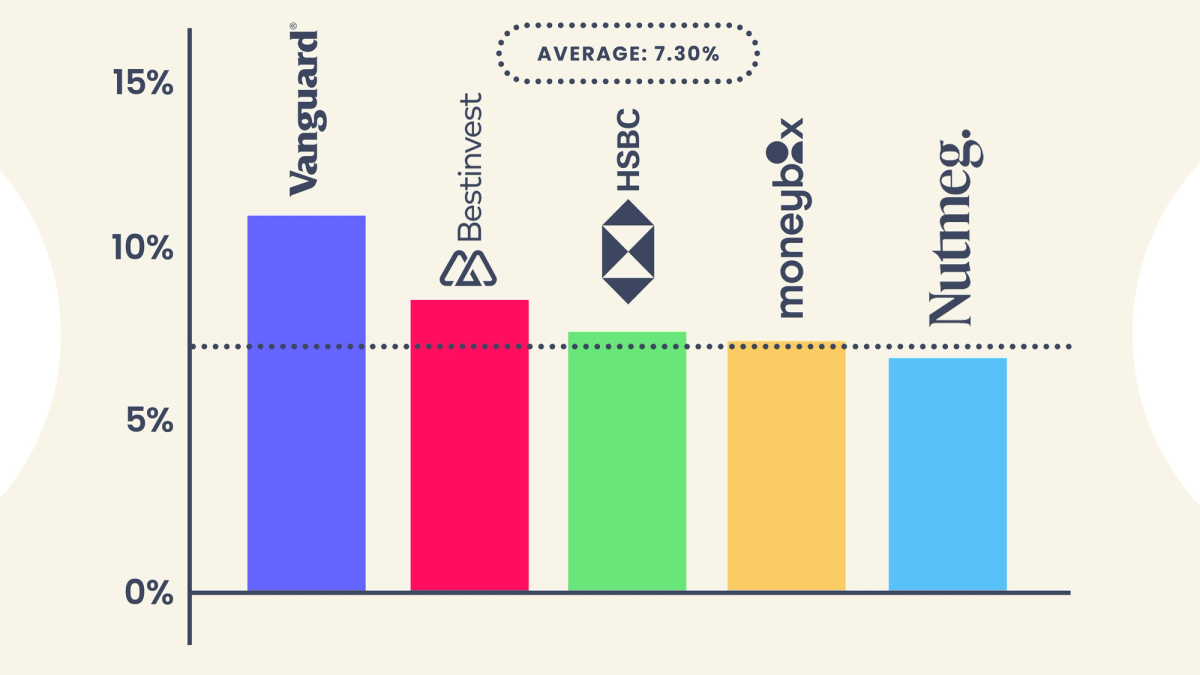
This graph illustrates 1-year returns net of charges for the top 5 performing ready-made solutions that are covered in our analysis. Performance covers the period between July 2022 – June 2023. Data correct as of 30th June 2023. The full fund/portfolio names can be found in the table below.
Get the full results!
Already have an account? Login
How did high risk ready-made solutions perform in Q2 2023?
Vanguard and AJ Bell have performed the best in this risk profile over the last 2 years, returning 6.9% and 6.6% respectively after all charges. At the other end of the scale, True Potential and Charles Stanley's portfolios struggled, with respective losses of 2.2% and 6.7% after charges.
Vanguard's good 2-year performance figure is largely down to excellent performance in 2023, with the LifeStrategy 100 fund returning 6.6% so far this year. This can be attributed to the strong performance of shares over the past 6 months, particularly in the US, where the S&P 500 returned close to 16%. Vanguard was perfectly placed to take advantage of this, with a 48% equity allocation to North America.
Interestingly, Vanguard has been slowly reducing its "home bias", with the equity allocation to the UK being gradually dialled down to the current 25% it sits at today. The FTSE 100 was resilient in 2022, whilst other international counterparts suffered losses. 2023 however has been a different story, with Europe, US and Japan all significantly outperforming the UK so far.
AJ Bell has also performed strongly and had a less bumpy ride. Performance has been more consistent, with positive returns across the past 2 rolling 12-month periods respectively. AJ Bell's geographical allocation is spread fairly evenly, with 38% in Europe (including 27% in the UK), 32% in the Americas and 30% in Asia. They have seen lower relative performance however over the last 6 months and so will be one to watch going forward.
HSBC has also been a consistently strong performer in this category. Similar to Vanguard, HSBC has a high US allocation - currently 50% of the fund tracks the performance of the S&P 500.
Best performing high risk ready-made solutions in Q2 2023
Provider | Fund / Portfolio | Risk Level | Q2 2023 Net Growth | 1 Year Net Growth | 2 Year Net Growth |
Moneybox | Adventurous | High | 3.38% | 7.37% | 3.51% |
HSBC | Adventurous | High | 3.23% | 7.41% | 4.83% |
Charles Stanley | Multi Asset Adventurous | High | 2.41% | 6.94% | -6.68% |
Vanguard | LifeStrategy 100 | High | 2.39% | 10.62% | 6.86% |
Wealthify | Adventurous | High | 2.24% | 6.65% | -0.22% |
Vanguard | LifeStrategy 80 | High | 1.45% | 7.13% | 1.33% |
Hargreaves Lansdown | Moderately Adventurous Managed | High | 1.41% | N/A | N/A |
Nutmeg | 8 | High | 1.23% | 7.24% | -1.46% |
Bestinvest | Smart Maximum Growth | High | 1.11% | 8.41% | N/A |
True Potential | Aggressive | High | 1.09% | 4.93% | -2.15% |
AJ Bell | Adventurous | High | 0.82% | 6.30% | 6.56% |
This table displays performance over multiple timeframes across the past 2 years for a range of investment funds/portfolios. Performance has been calculated net of investment and platform charges. Risk levels have been classified based on Boring Money’s parameters, which can be found in the ‘key terms’ section. Performance figures have either come directly from platforms or been estimated using the value of fund assets, assuming frequent rebalancing.
Key terms:
Provider
The investment provider offering and managing the ready-made solution.
Fund/Portfolio
The name of the particular fund/portfolio held on the investment provider’s platform. This will typically include a mixture of cash, bonds and shares at different proportions depending on your chosen risk level. All funds/portfolios included in this article can also be classified as ready-made solutions.
Risk Level
The perceived level of risk associated to a ready-made solution. Boring Money assign each ready-made solution to a risk level, based on its equity allocation. For the purpose of this exercise, there are three risk levels. Investments with an equity exposure of under 35% are considered low risk, investments with an equity exposure between 35% - 75% are considered medium risk, and investments with an equity exposure above 75% are considered high risk.
Q2 2023
'2nd quarter'. The period between 1 April 2023 and 30 June 2023.
Net Growth
The total growth of a ready-made solution minus charges. Charges include both fees paid for managing the investment and fees paid for using the investment provider’s platform.