Best performing ready-made solutions of July – September 2023
Discover which portfolios were top of the pops
By Boring Money
19 Oct, 2023
Every three months we get performance data from the leading ready-made investment portfolios made available to retail investors. We group these into three risk categories and take a look at who has performed the best after all fees and charges over various timeframes.


Join Boring Money
Already have an account? Login
How did ready-made solutions perform in Q3 2023?
In this quarter’s dig into portfolio returns, we can see the 1-year numbers start to look a bit more normal after a really bad 2 years. The average high risk portfolio has gone up by over 7% in the last 12 months, outperforming cash again to investors’ relief - although of course by investing in riskier assets.
For the last few years it’s really been a story of the US stock market. Harsh critics might say that a monkey could have bought a collection of US tech stocks and done well. However, now the picture is becoming more nuanced and we’re entering a period where more skill will be required to deliver consistent and strong numbers.
In the last three months, US shares have been less rosy and actually the unloved UK has done a bit better. And bonds have settled a bit although we remember their inverse relationship to interest rates – so as we forecast the top of the cycle and rates to start falling, then actually the consensus is that shorter-term bonds will go up. So the precise mix of bonds in these providers’ shopping baskets has had a big impact on performance.
As always, when looking at performance, we should try and look at a longer timeframe to really evidence skill. 3 months is interesting, sure, but not enough. So look at the 2-year numbers with more care. And also remember to look at how much risk people make to get the returns.
Someone who allocates half of your money to riskier shares and makes 5%, for example, is arguably doing much better than someone who allocates all of your money to shares and makes 7% for example. So look at who is top or who is bottom, but check out how much risk they’re taking to do this.


High risk ready-made solutions

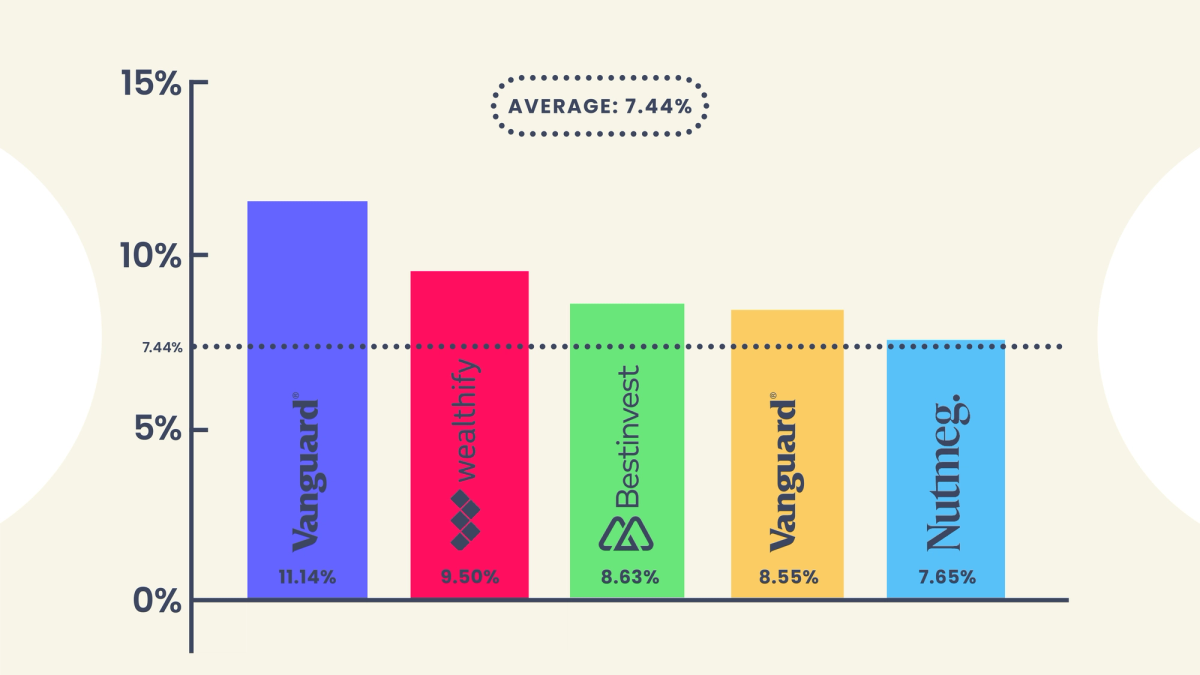
Graph illustrating net returns for one year covering October 2022 - September 2023 of the top 5 performing ready-made solutions against the average of all of the high risk funds/portfolios covered in our analysis. Data correct as at 30th September 2023. Returns calculated net of charges. The full fund/portfolio names can be found in the table below.
In general, global shares went down in Q3, after a promising first 6 months of 2023. Despite poorer performance over the last quarter, 2023 has been a much better year for shares than 2022. The average high risk portfolio in our content series has returned 7.4% across the past 12 months, compared to 0.04% in the past 24-months.
Most high risk portfolios had positive returns in Q3, with AJ Bell topping the list. Charles Stanley's multi-asset adventurous portfolio is the exception, with a negative return of -1.1%. If we look over a 2-year period the gap widens, with AJ Bell's adventurous fund returning 8.1% compared to -8.9% for Charles Stanley's.
Investors want to know what lies behind these variations. As a general rule, over the last few years the main contributing factors have been how much is allocated to the US, how much is in the UK and how much has been in bonds which are so influenced by interest rates.
If we look at AJ Bell, our top performer, we note they hold 28% in the UK, compared to just 6% of Charles Stanley's portfolio. To get access to UK markets, AJ Bell include a ‘FTSE All Share Index’ fund and an ‘all-cap ETF’ in their portfolio, with both returning circa 14% in the past 12 months and making a very positive contribution. UK markets have been typically unloved in the last few years but this quarter they have done better, so boost returns for those providers who have bet a bit more on this market.
Vanguard LifeStrategy 100 and HSBC's Global Strategy Adventurous fund are the only other 2 portfolios to return over 1% across the past 2 years. This doesn’t sound great, but remember the hugely negative impact of Liz Truss’ mini-Budget, war, inflation and other events which have rattled markets. Both Vanguard and HSBC’s portfolios have over 50% exposure to US markets and benefited from strong S&P 500 performance in the first half of 2023.
Apart from AJ Bell, who buck the trend, we see a notable correlation between the top performers over the last 2 years and the amount they choose to invest in the US – for these share-based portfolios this has arguably been the biggest driver of better performance across the board.


Provider | Fund / Portfolio | Risk Level | Q3 2023 Net Growth | 1 Year net Growth | 2 Year Net Growth |
AJ Bell | Adventurous | High | 1.02% | 6.53% | 8.06% |
Bestinvest | Smart Maximum Growth | High | 0.71% | 8.63% | N/A |
Vanguard | LifeStrategy 100 | High | 0.67% | 11.14% | 6.01% |
Wealthify | Adventurous | High | 0.47% | 9.50% | -1.21% |
HSBC | Adventurous | High | 0.36% | 6.48% | 2.13% |
Moneybox | Adventurous | High | 0.21% | 4.92% | 0.42% |
Vanguard | LifeStrategy 80 | High | 0.08% | 8.55% | 0.30% |
True Potential | Aggressive | High | 0.05% | 5.81% | -3.40% |
Hargreaves Lansdown | Moderately Adventurous Managed | High | 0.00% | N/A | N/A |
Charles Stanley | Multi Asset Adventurous | High | -1.09% | 5.14% | -8.87% |
Nutmeg | 8 | High | - | 7.65% | -3.11% |
This table displays performance over multiple timeframes across the past 2 years for a range of investment funds/portfolios. Performance has been calculated net of investment and platform charges. Risk levels have been classified based on Boring Money’s parameters, which can be found in the ‘key terms’ section. Performance figures have either come directly from platforms or been estimated using the value of fund assets, assuming frequent rebalancing.
Medium risk ready-made solutions

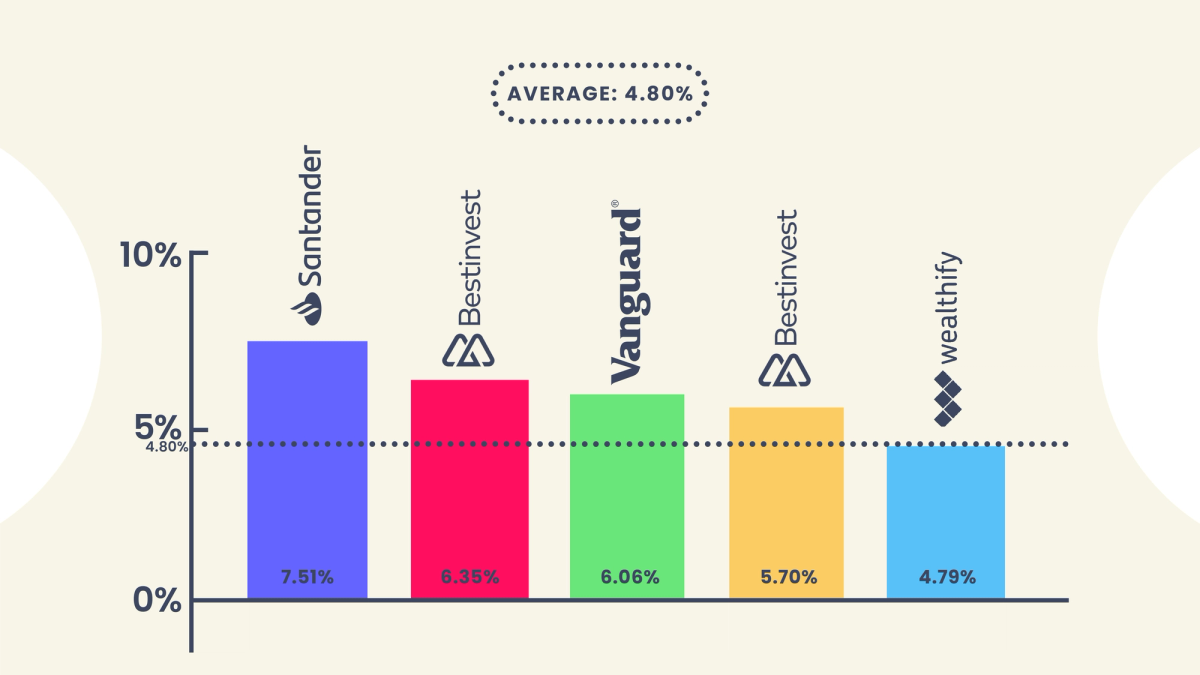
Graph illustrating net returns for one year covering October 2022 - September 2023 of the top 5 performing ready-made solutions against the average of all of the medium risk funds/portfolios covered in our analysis. Data correct as at 30th September 2023. Returns calculated net of charges. The full fund/portfolio names can be found in the table below.
The medium risk portfolios have lost an average of -5.5% over the past 2 years, with only AJ Bell's balanced fund posting a positive return over this timeframe. Interestingly, when looking over only the past 12 months instead, every portfolio has positive returns, which range from 2.9% - 7.5%. This is a more typical year and what we would expect for these mid-range portfolios which are a mix of shares and bonds.
Santander, Bestinvest and Vanguard's LifeStrategy (LS) 60 have performed best over the past 12 months. 3 of Santander's 4 largest holdings are in UK shares, making a total of 28% of the overall portfolio. These, alongside its exposure to Developed Europe have helped returns in the past year. On the other hand, Santander have a very low exposure to US shares, which may have proved useful in the past quarter as this once unstoppable market faltered but has detracted from longer-term returns over the past couple of years.
We include both Vanguard LS 40 and LS 60 in this risk bracket. The number reflects the % of shares held in the portfolio. You’d typically expect something with 60% in shares to be much more volatile, but to make more over the long run.
Bonds have been troubled in recent times. Their price moves in the opposite way to interest rates - so as interest rates go up, bond prices go down. High interest rates have contributed to the poor performance of bonds over the past couple of years, and hence portfolios with a higher allocation to bonds have typically suffered. If we can get high interest rates from cash, 'why bother with bonds?' is the basic gist here. And when fewer people want something, its price goes down. Investors locked into long-term agreements (think of them as ‘IOUs’), such as 10 or 20-year government bonds, are keen to get out and so will accept a lower price than they paid to sell their bond contracts to someone else.
One thing all investors need to consider is how much risk they are taking to get the return. It’s worth noting that Moneybox has the highest % of ‘risky’ or ‘volatile’ shares in this collection of portfolios, but shows the lowest 1-year returns. Although their 2-year returns are solid, it’s worth investors asking ‘why?’. There may well be a very good reason, but we do need to consider returns, not in isolation, but alongside the risk we’re taking to get there. The optimum position we all want to see is maximum returns for minimum risk! So just have a look at how much is in shares as well as total returns when you’re doing your comparisons.
Provider | Fund / Portfolio | Risk Level | Q3 2023 Net Growth | 1 Year net Growth | 2 Year Net Growth |
AJ Bell | Balanced | Medium | 0.90% | 4.03% | 2.53% |
Bestinvest | Smart Cautious | Medium | 0.63% | 5.70% | N/A |
Santander | Multi-index Fund 4 | Medium | 0.48% | 7.51% | -3.86% |
Moneybox | Balanced | Medium | 0.36% | 2.89% | -1.42% |
Bestinvest | Smart Growth | Medium | 0.05% | 6.35% | N/A |
Wealthify | Confident | Medium | -0.14% | 4.79% | -6.59% |
Vanguard | LifeStrategy 60 | Medium | -0.43% | 6.06% | -4.98% |
HSBC | Balanced | Medium | -0.46% | 3.95% | -4.24% |
Hargreaves Lansdown | Balanced Managed | Medium | -0.67% | N/A | N/A |
True Potential | Balanced | Medium | -0.70% | 4.03% | -7.25% |
Vanguard | LifeStrategy 40 | Medium | -0.98% | 3.52% | -9.92% |
Charles Stanley | Multi Asset Growth | Medium | -1.09% | 4.04% | -9.97% |
Nutmeg | 5 | Medium | - | 4.73% | -8.98% |
This table displays performance over multiple timeframes across the past 2 years for a range of investment funds/portfolios. Performance has been calculated net of investment and platform charges. Risk levels have been classified based on Boring Money’s parameters, which can be found in the ‘key terms’ section. Performance figures have either come directly from platforms or been estimated using the value of fund assets, assuming frequent rebalancing.
Low risk ready-made solutions

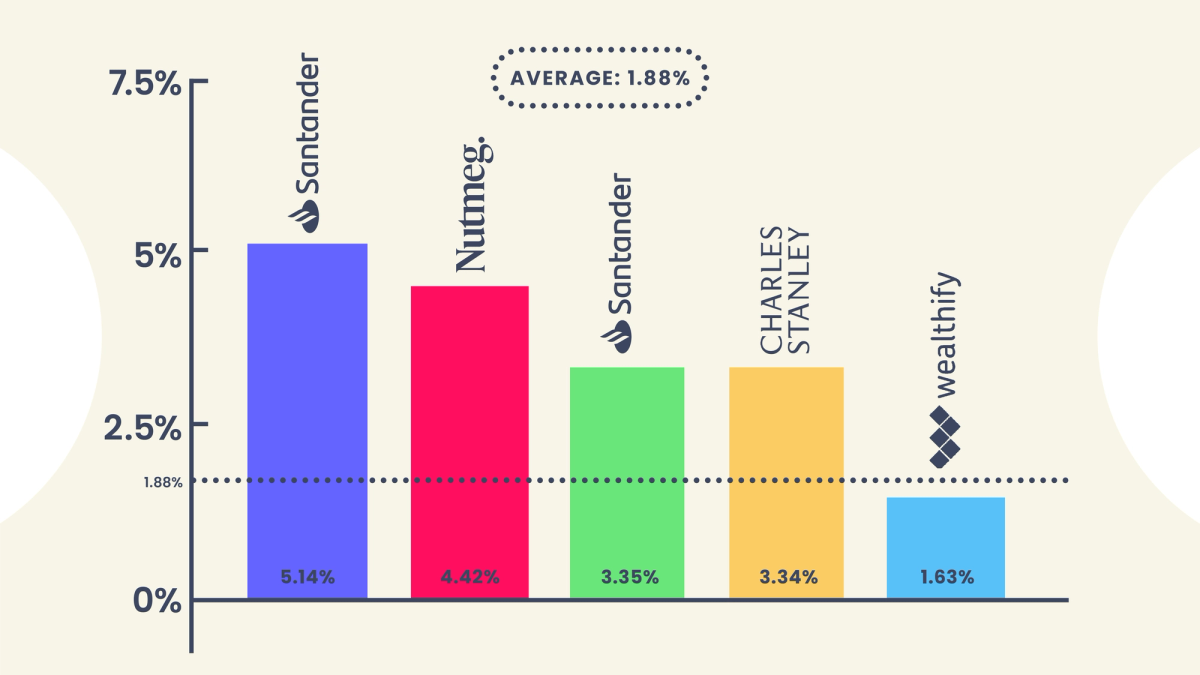
Graph illustrating net returns for one year covering October 2022 - September 2023 of the top 5 performing ready-made solutions against the average of all of the low risk funds/portfolios covered in our analysis. Data correct as at 30th September 2023. Returns calculated net of charges. The full fund/portfolio names can be found in the table below.
Low risk portfolios have lost an average -9.2% in the past 2 years. Say what?! If high negative returns from a 'low risk' investment over such a short timeframe feels bizarre to you - don't worry, it is. Research from Deutsche Bank suggests that 2022 had the worst combined total return for stocks and bonds, in an annual assessment that goes as far back as 1872!
It is hard to over-emphasise the negative impact that Liz Truss’s mini-Budget had on investor confidence, shaking global markets and ‘messing up’ normally stable, boring, predictable bonds which temporarily went haywire. You wouldn't be alone in hoping this is a once-in-a-generation event.
Every single low risk portfolio we track has negative performance when looking over a 2-year timeframe, with AJ Bell performing best with a relatively high -4.6%.
If we shorten the time horizon to the past 12 months however, things look much healthier. Santander's Multi-Index fund 2 and Nutmeg's risk level 2 portfolio have positive growth of 5.1% and 4.4% respectively over this timeframe, whilst Charles Stanley's cautious multi-asset fund is best performing so far in 2023, with 1.4% growth since the beginning of the year.
One driver of the different performances is that not all bonds are equal. Bond issues have different credit ratings, which have been designed to help investors distinguish the riskiness of loaning money to a particular company, government, or project. Standard & Poor is a credit rating agency that is widely used and their investment grade bond ratings range from AAA to BBB- .
Naturally, AAA bonds are considered the safest and companies/governments with those ratings have demonstrated a high capacity to repay loans. Anything below BBB- is considered below investment grade and is colloquially referred to as a 'high-yield' or 'junk bond'. Basically, if you lend money to US government, it's less risky than lending it to a mining company in Bolivia (for example), so you don’t expect such a big potential return.
AJ Bell's cautious fund has roughly 58% of its bond exposure in bonds rated A or above, compared to its benchmark average of 77%. Instead, 28% of its bonds exposure is in BBB rated bonds, which - whilst still considered investment grade - are riskier than A rated bonds. In the world of bonds, riskier bonds have higher pay-offs, as long as the company does not default on the loan.
Another factor that will impact returns is the term of the bonds. Over recent times, shorter-term bonds have done better because people think rates will start to fall in the short-term – so they anticipate returns will go up.
Provider | Fund / Portfolio | Risk Level | Q3 2023 Net Growth | 1 Year net Growth | 2 Year Net Growth |
AJ Bell | Cautious | Low | 0.58% | 0.71% | -4.60% |
Santander | Multi-index Fund 1 | Low | 0.47% | 3.35% | -16.49% |
Santander | Multi-index Fund 2 | Low | 0.47% | 5.14% | -12.67% |
Moneybox | Cautious | Low | 0.22% | -1.76% | -4.75% |
Wealthify | Cautious | Low | 0.18% | 1.63% | -10.84% |
Charles Stanley | Multi Asset Cautious | Low | -0.19% | 3.34% | -7.97% |
True Potential | Defensive | Low | -0.50% | 0.94% | -7.34% |
Vanguard | LifeStrategy 20 | Low | -1.51% | 1.42% | -14.33% |
Hargreaves Lansdown | Cautious Managed | Low | -1.55% | 0.49% | -4.69% |
HSBC | Cautious | Low | -1.60% | 1.03% | -11.48% |
Nutmeg | 2 | Low | - | 4.42% | -6.18% |
This table displays performance over multiple timeframes across the past 2 years for a range of investment funds/portfolios. Performance has been calculated net of investment and platform charges. Risk levels have been classified based on Boring Money’s parameters, which can be found in the ‘key terms’ section. Performance figures have either come directly from platforms or been estimated using the value of fund assets, assuming frequent rebalancing.
Key terms:
Provider
The investment provider offering and managing the ready-made solution.
Fund/Portfolio
The name of the particular fund/portfolio held on the investment provider’s platform. This will typically include a mixture of cash, bonds, and shares at different proportions depending on your chosen risk level. All funds/portfolios included in this article can also be classified as ready-made solutions.
Equities
Another name for 'shares' or 'stocks', equities are small slices of a company which investors can buy in order to invest in them. If the company does well, its equities will increase in value. If it doesn't, it's equities will fall in value. Read our full guide here for more info.
Bonds
Bonds are like IOUs between you and a company or government. You can lend them money by way of a loan and they pay you interest on this loan. This interest is called the bond 'yield' and the amount differs depending on how risky the loan is perceived to be - that is, how likely the borrower is to be unable to repay it. Bonds are usually considered to be lower risk investments and frequently feature in low and medium risk investment portfolios. You can read more about bonds here.
Credit rating
In the investment world, a bond's 'credit rating' is used to make a judgement on the quality and risk involved in investing in it. Ratings are published by recognised credit rating agencies, such as Standard & Poor, and are used by investing professionals to determine the likelihood that the bond's underlying loan will be repaid. Bond credit ratings are different from an individual's credit rating or score, which you can read about here.
Risk Level
The perceived level of risk associated to a ready-made solution. Boring Money assign each ready-made solution to a risk level, based on its equity allocation. For the purpose of this exercise, there are three risk levels. Investments with an equity exposure of under 35% are considered low risk, investments with an equity exposure between 35% - 75% are considered medium risk, and investments with an equity exposure above 75% are considered high risk.
Q3 2023
'3rd quarter'. The period between 1 July 2023 and 30 September 2023.
Net growth
The total growth of a ready-made solution minus charges. Charges include both fees paid for managing the investment and fees paid for using the investment provider’s platform.