How have our investments performed?
27 Jan, 2021
We wanted to show you how different fees and funds affect how investment providers perform. After much frustration and endless Excel spreadsheets, we decided that the easiest and least controversial way to measure who does well was simply to open an account with 15 platforms, stick £500 in each and see how they did. Here is our year three update.
In January 2018 we set up test accounts with 15 platforms and robo advisers, investing £500 in ready-made ‘medium risk’ portfolios or own brand multi-asset funds. We selected portfolios which had closest to 60% in equities in Q1 2018.
Top observations after three years invested
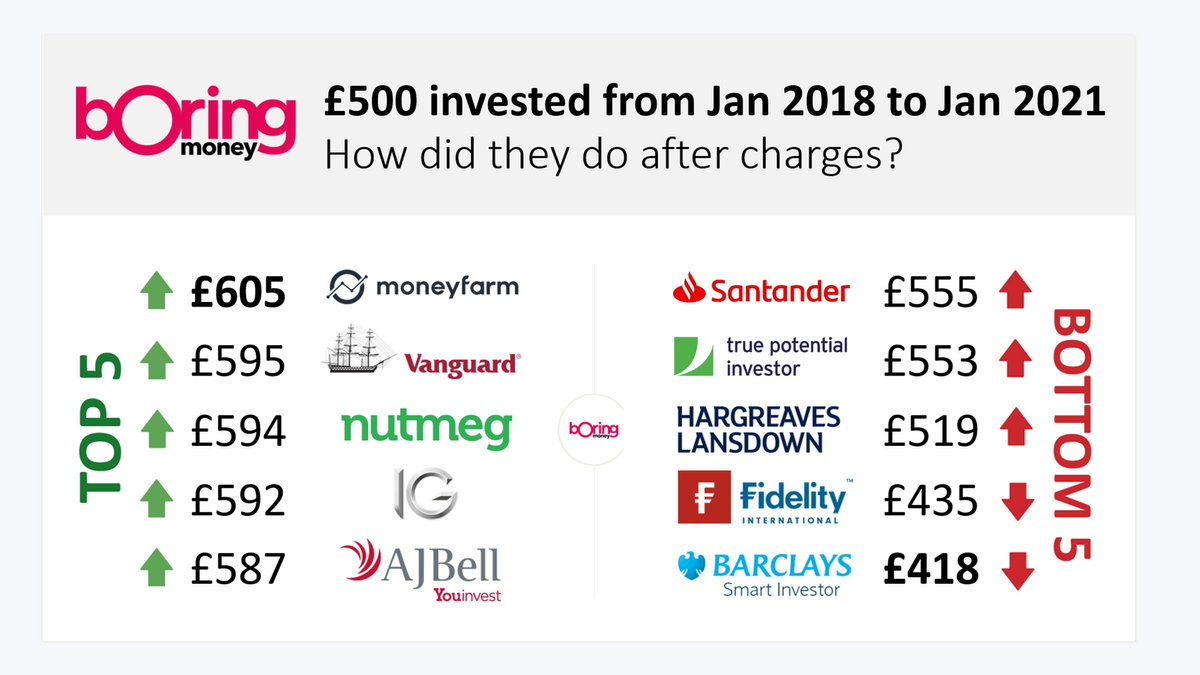
Over a three year period the top performer –net of fees – has grown to £605, an increase of 21%
Moneyfarm, Vanguard and Nutmeg were the top performing portfolios net of charges
After fees, the average balance across all robo accounts in 2021 was £552 – an increase of 11% over a three-year period. For comparison, over the same period the FTSE 100 was down by 14%
If we consider medium risk portfolio returns over both a 12 month and 3 year period, Vanguard, Nutmeg and AJ Bell Youinvest have performed consistently well

Performance of medium-risk portfolios over a three-year period
Note: Fidelity and Barclays include a fixed fee element which impacts net performance on smaller accounts
Holly Mackay, our CEO, observes:
- “As robo advisers experience continued growth, longer track records are shifting the focus from who has the snappiest app to a more fundamental performance decision.
- “Over the past three years my £500 investment has made me £86 more with one provider than another. This sort of difference is material – and currently largely impossible to see if you are a retail customer shopping around for a ready-made solution.”
What’s in a name – medium risk portfolios have diverged over three years
Over three years, these medium risk portfolios have also diverged in asset allocations. The average % in shares of all providers in the medium risk bracket is 56% today. But in the portfolios, Moneyfarm’s equity allocation has shifted up to 79% and Wealthify’s has fallen to 43%.
If Boring Money had invested in Moneyfarm’s risk profile 5, for example, which is now closer to a 60% equity allocation, the notional balance after fees would have been £562.
Fixed fees impact smaller pots
A number of the providers have elements of fixed fees which make the charges disproportionately high for these small test accounts. Both Barclays and Fidelity have fixed fees or minimum monthly fees which disproportionately our smaller test accounts.
Boring Money modelled the same portfolios net of charges and based on a £50,000 portfolio, to illustrate the net position on these larger balances.

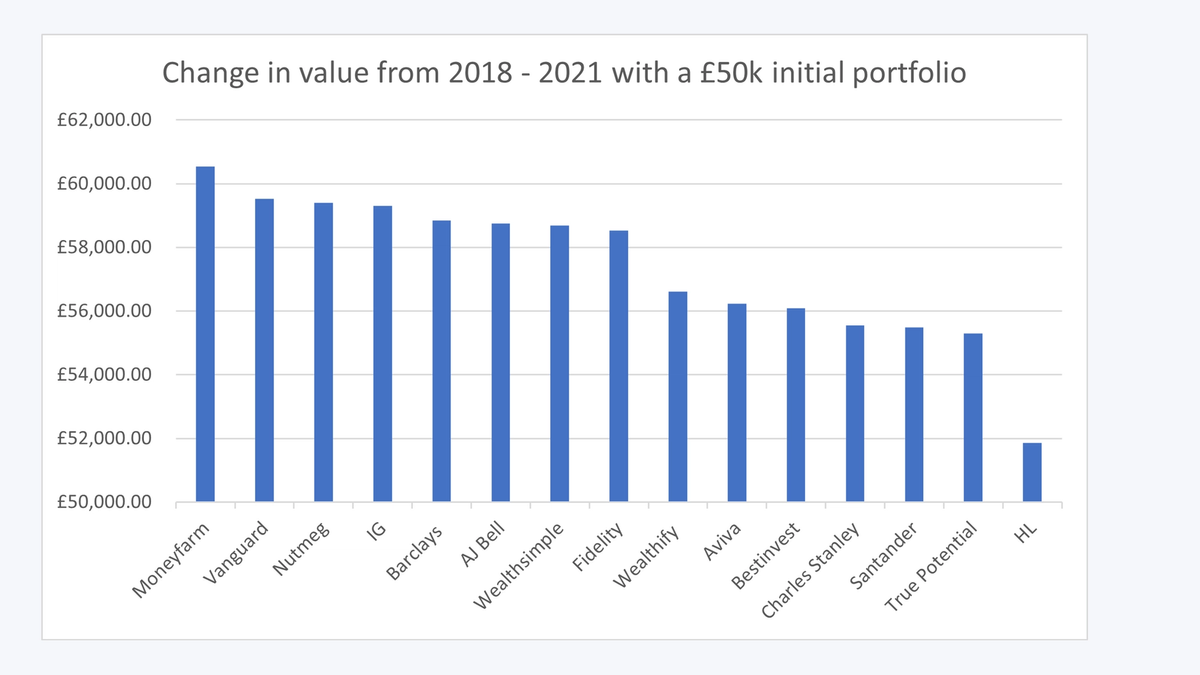
Passive portfolios with high US equity allocations have done best
When performance net of fees is looked at for larger £50,000 accounts, Santander, True Potential Investor and Hargreaves Lansdown performed the worst over a three-year period.
In addition to charges and equity allocations, the proportionate weighting to the US has been a key factor. The top three performers all had more than 40% of their overall share allocations in the US markets.
Holly concludes:
- “This exercise shows the benefits of diversification offered by robo advisers. It’s also a reminder for investors to check what lies under the bonnet every so often, as the % in shares can change dramatically from one year to the next.
- “After three years it’s also looking positive for the passive providers. The active portfolios we hold have not done better net of charges, even in such volatile markets.”
Full list of providers and funds
Platform: AJ Bell
Fund: VT AJ Bell Balanced I Acc
Asset Allocation: 56.45%
Platform: Barclays
Fund: Barclays Wealth Gbl Mkts 3 R A
Asset Allocation: 50.00%
Platform: Bestinvest
Fund: Tilney Growth Portfolio
Asset Allocation: 67.12%
Platform: Charles Stanley
Fund: CS Multi Asset 3
Asset Allocation: 47.00%
Platform: Fidelity
Fund: Multi Asset Allocator Growth Fund
Asset Allocation: 56.11%
Platform: HL
Fund: Multi-manager Balanced
Asset Allocation: 60.32%
Platform: IG
Fund: Balanced Portfolio
Asset Allocation: 45.79%
Platform: Nutmeg
Fund: Portfolio 5 ESG
Asset Allocation: 46.76%
Platform: Moneyfarm
Fund: Aggressive Portfolio 6/7
Asset Allocation: 78.91%
Platform: Santander
Fund: Santander Multi-Index 3
Asset Allocation: 58.77%
Platform: True Potential
Fund: Balanced Blended Portfolio
Asset Allocation: 59.96%
Platform: Wealthify
Fund: Confident Portfolio
Asset Allocation: 43.40%
Platform: Wealthsimple
Fund: Balanced Portfolio
Asset Allocation: 50.00%
Platform: Vanguard
Fund: Vanguard LS 60
Asset Allocation: 60.00%
How have robo advisers & investment platforms done with their ‘ready-made’ investment solutions for investors?
Trying to work out which investment providers have performed well after fees is no easy task. After much frustration and endless Excel spreadsheets, we decided that the easiest and least controversial way to measure who does well was simply to open an account, stick £500 in and see how they did. Here is our January 2020 independent guide for consumers.
Platform performance for ‘ready-made’ solutions.