Best performing ready-made solutions of July – September 2024
Discover which portfolios were top of the pops
By Boring Money
15 Oct, 2024
Every three months we get performance data from the leading ready-made investment portfolios made available to retail investors. We group these into three risk categories and take a look at who has performed best over various timeframes after all fees and charges have been taken into account.


How did ready-made solutions perform in Q3 2024?
Ready-made solutions had another good quarter, with every portfolio barring one generating a positive return in Q3. Amidst a backdrop of a few instances of pronounced volatility in equity markets, alongside interest rate cuts in many major economies, the low risk options thrived and outperformed the higher risk options over the three-month period.
Return figures are encouraging when looking over longer timeframes, as the 1-year and 2-year periods move further away from some of the challenges faced in 2022, instead incorporating more lucrative quarters of market recovery and growth.
Across the past 12 months, all the ready-made solutions have returned between 5% – 19%, beating cash rates. Extending this to cover the past 2 years, the vast majority have returned between 10-30%, with high risk solutions leading the way as expected.


Average performance of each risk category
The table below illustrates the average performance of ready-made solutions from the three risk categories - high, medium and low - across the different time periods we track:
Risk Level | Q3 2024 AVERAGE NET GROWTH | 1 YEAR AVERAGE NET GROWTH | 2 YEAR AVERAGE NET GROWTH |
High Risk | 1.2% | 16.7% | 25.6% |
Medium Risk | 2.1% | 13.9% | 19.4% |
Low Risk | 2.5% | 10.3% | 12.0% |
High risk ready-made solutions

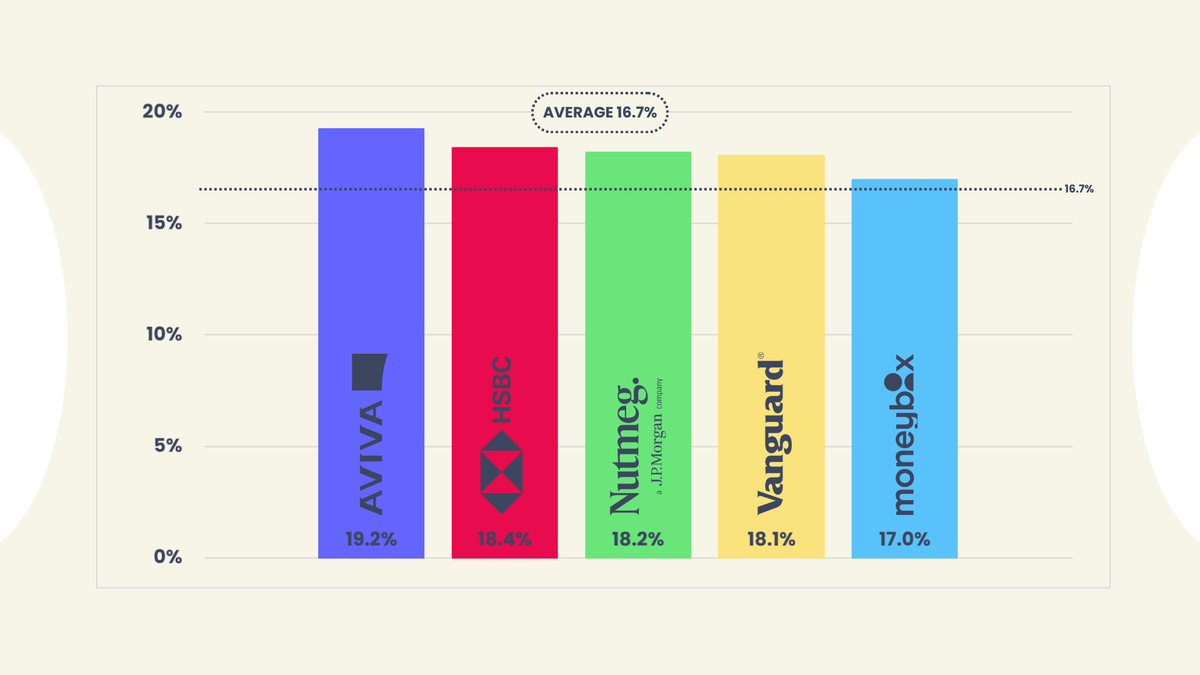
Graph illustrating net returns for one year covering October 2023 - September 2024 of the top 5 performing ready-made solutions against the average of all of the high risk funds/portfolios covered in our analysis. Data correct as at 30th September 2024. Returns calculated net of charges. The full fund/portfolio names can be found in the table below.
Global markets continued to rise in Q3, despite bouts of severe volatility. The average high risk portfolio returned a muted 1.2% across the quarter, although this leaps up to 16.7% and 25.6% when widening the timeframe to 1 and 2 years respectively.
All top 3 performers over the quarter are in the bottom half of the performance charts over a 2-year period, reflecting some of the rotational shifts visible in the market, as value and small-cap came into the fore over the last few months.
Halifax and Charles Stanley's ready-made options both returned 2.2% after charges in Q3, 1% higher than the average high risk option. Halifax's Progressive fund has an equity allocation of roughly 90%, with UK equity holdings constituting approximately 1/4 of the overall investments. The FTSE 100 is up by 7% YTD, while the FTSE 250 is currently up 6% since the beginning of 2024 and 18% over the past 12 months.
Many analysts still feel that despite recent positive stock market performance, the UK is still an undervalued sector, with widely-used metrics like price-to-equity and price-to-book ratios supporting this idea.
Charles Stanley's Adventurous fund has a similarly high equity allocation to Halifax, however, the composition is starkly different, with only 7% in UK equities, 7% in Japan, and 11% across other countries in the Asian Pacific. China caught everyone's attention at the end of Q3, finishing the quarter extremely well after policymakers approved a significant economic package at the end of September.
Looking over a longer time period, Aviva and Nutmeg are the top 3 performers over both 1 and 2 years. Nutmeg's fully-managed Portfolio 10 has a 100% equity allocation, with roughly 55% held in US equities. Interestingly, the fund's largest 3 holdings are all S&P 500 ETFs, which combine for over 40% of the portfolio.
The ever-increasing presence of the Magnificent 7 within the S&P 500 index has contributed significantly to the S&P's strong returns in the past few years, although at present there are many question marks over how diversified the index is and whether it can continue to generate such strong returns, off the back of the performance of a select sub-set of companies.
Provider | Fund / Portfolio | Risk Level | Q3 2024 Net Growth 👇 | 1 Year net Growth | 2 Year Net Growth |
Halifax | Managed Growth 6 | High | 2.2% | 16.1% | 24.9% |
Charles Stanley | Multi Asset Adventurous | High | 2.2% | 16.6% | 22.6% |
AJ Bell | Adventurous | High | 1.9% | 15.4% | 23.0% |
Wealthify | Adventurous | High | 1.7% | 15.8% | 26.8% |
True Potential | Aggressive | High | 1.7% | 16.9% | 25.5% |
Santander | Multi-index Fund 4 | High | 1.5% | 14.1% | 22.7% |
Bestinvest | Smart Maximum Growth | High | 1.3% | 15.1% | 25.1% |
HSBC | Adventurous | High | 1.0% | 18.4% | 26.1% |
Moneybox | Adventurous | High | 0.8% | 17.0% | 22.9% |
Vanguard | LifeStrategy 100 | High | 0.7% | 18.1% | 31.2% |
Aviva | Multi-asset Plus V | High | 0.1% | 19.2% | 27.0% |
Hargreaves Lansdown | Adventurous Managed | High | -0.6% | 16.6% | N/A |
Nutmeg | 10 | High | - | 18.2% | 29.4% |
This table displays performance over multiple timeframes across the past 2 years for a range of investment funds/portfolios. Performance has been calculated net of investment and platform charges. Risk levels have been classified based on Boring Money’s parameters, which can be found in the ‘key terms’ and 'methodology' sections below. Performance figures have either come directly from platforms or been estimated using the value of fund assets, assuming frequent rebalancing.
Medium risk ready-made solutions

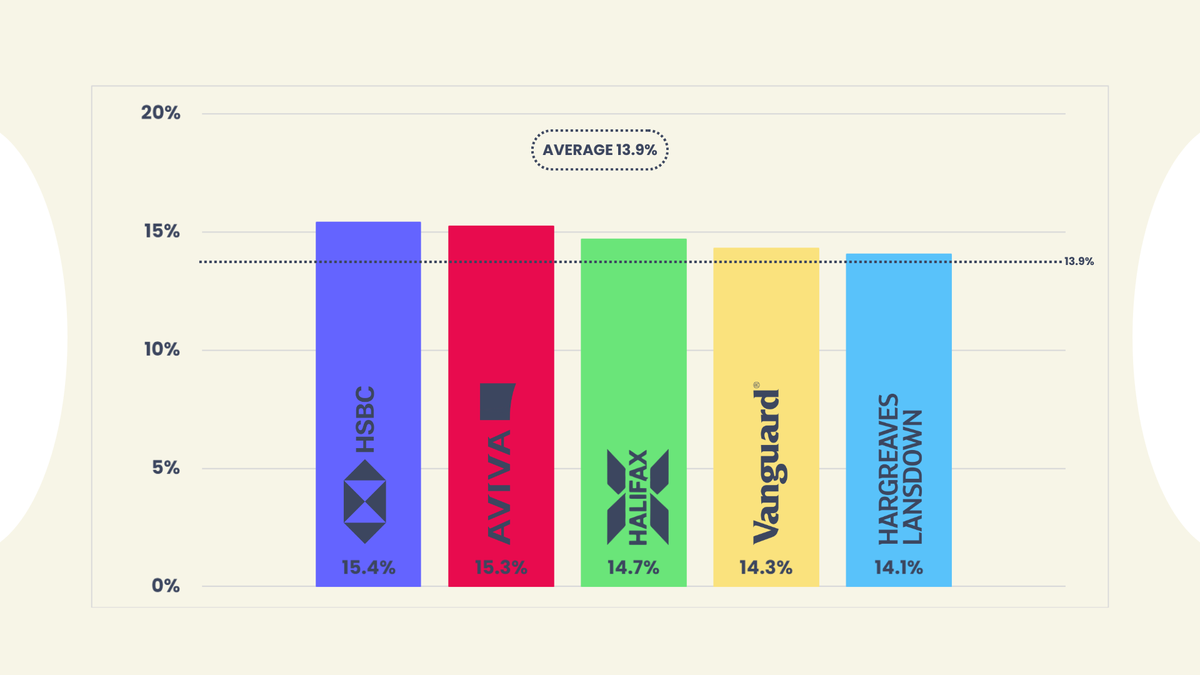
Graph illustrating net returns for one year covering October 2023 - September 2024 of the top 5 performing ready-made solutions against the average of all of the medium risk funds/portfolios covered in our analysis. Data correct as at 30th September 2024. Returns calculated net of charges. The full fund/portfolio names can be found in the table below.
The average medium risk portfolio returned 2.1% in Q3 2024, increasing to 13.9% over the past 12 months and 19.4% across a 2-year timespan. All providers performed strongly across the quarter, with a tight range of only 0.9% between the 10 providers. Medium risk as a category also outperformed its high risk counterparts, due to its greater allocation to bonds; highlighting the importance and benefit of diversification across asset classes.
Halifax's Balanced solution was the best performer in Q3, returning 2.8%. The fund has an equity allocation of roughly 65% and a UK asset allocation of 33% which is split pretty evenly between shares and bonds. When looking across the past 12 months, HSBC's Balanced option is the strongest performer, growing by 15.4%.
With all the attention on interest rates and risk-free returns of 5% on money held in cash over the past couple of years, it is easy to forget how significant the difference in investing and saving can be; especially when considering a diversified portfolio across a wide time period.
Wealthify, Halifax, and Vanguard took the top spot over the wider 2-year timeframe, returning 21.7%. This is 5% higher than AJ Bell, who find themselves at the tail-end of the list in all three time periods. Wealthify's Ambitious plan typically has 60-65% in equity investments and has a regional exposure of roughly 25% to the UK, double its US allocation.
Passive investments are mainly used within the plan, although Wealthify has actively opted to currency hedge a significant proportion of its foreign exposure. There are also small allocations towards alternative investments included within the plan, with roughly 6% exposure split between private equity, property, and commodity ETFs.
A currency hedge protects an investment in a foreign country from being impacted by changes in the exchange rate. Non-hedged investments can generate returns via growth in the actual investment, or appreciation in the foreign currency.
For example, imagine investing £1,000 in Apple, at an exchange rate of 2 USD per GBP (50p = $1). This buys you $2,000 worth of Apple shares. Now assuming the Apple shares stay at the same price, but the dollar gets stronger, up to the point where it is now equal to £1. At this point, if you sell your $2,000 worth of Apple shares and convert it back to pounds, you would get £2,000, which would give you £1,000 profit on your initial investment.
However, all of this growth would have come from the change in the USD/GBP exchange rate, not the actual Apple investment. This can work oppositely as well, with investors losing money if GBP gets stronger in comparison to the foreign currency that they are holding their investments in; which is what has happened recently.
12 months ago, £1 was worth $1.21, now it is worth $1.31. That means any non-hedged investment in the US stock market would have had to overcome 7.4% worth of currency movement in the past year just to break even! Wealthify's hedging avoids this issue for its customers and has been a positive contributor to returns in the past 12 months.
Provider | Fund / Portfolio | Risk Level | Q3 2024 Net Growth 👇 | 1 Year net Growth | 2 Year Net Growth |
Halifax | Managed Growth 4 | Medium | 2.8% | 14.7% | 21.6% |
True Potential | Balanced | Medium | 2.5% | 14.0% | 19.5% |
Charles Stanley | Multi Asset Moderate | Medium | 2.2% | 12.9% | 17.6% |
HSBC | Balanced | Medium | 2.1% | 15.4% | 20.0% |
Wealthify | Ambitious | Medium | 2.1% | 13.7% | 21.7% |
Bestinvest | Smart Balanced | Medium | 2.0% | 12.7% | 18.9% |
Aviva | Multi-asset Plus II | Medium | 2.0% | 15.3% | 18.3% |
Vanguard | LifeStrategy 60 | Medium | 1.9% | 14.3% | 21.2% |
AJ Bell | Balanced | Medium | 1.9% | 12.1% | 16.7% |
Hargreaves Lansdown | Balanced Managed | Medium | 1.9% | 14.1% | N/A |
Nutmeg | 5 | Medium | - | 13.5% | 18.9% |
This table displays performance over multiple timeframes across the past 2 years for a range of investment funds/portfolios. Performance has been calculated net of investment and platform charges. Risk levels have been classified based on Boring Money’s parameters, which can be found in the ‘key terms' and 'methodology' sections below. Performance figures have either come directly from platforms or been estimated using the value of fund assets, assuming frequent rebalancing.
Low risk ready-made solutions

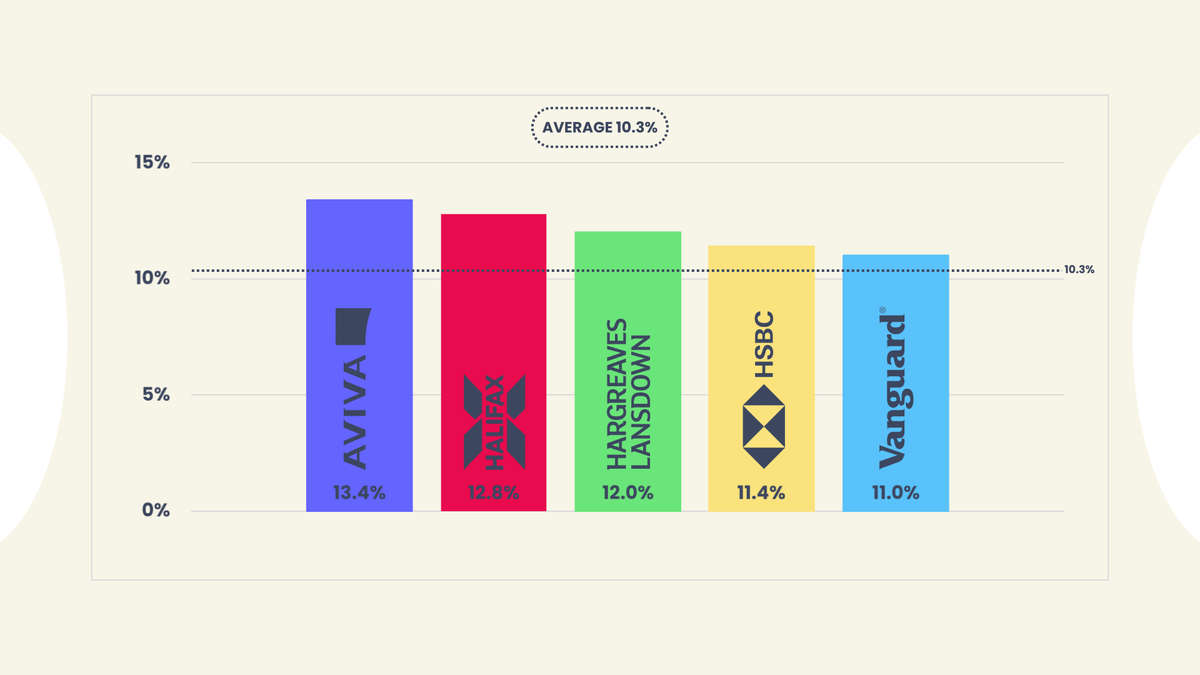
Graph illustrating net returns for one year covering October 2023 - September 2024 of the top 5 performing ready-made solutions against the average of all of the low risk funds/portfolios covered in our analysis. Data correct as at 30th September 2024. Returns calculated net of charges. The full fund/portfolio names can be found in the table below.
The average low risk portfolio returned 2.5% across Q3, 10.3% across the past 12 months, and 12% when assessing over the longer 2-year timeframe. Interestingly, Q3 was one of the anomaly quarters when low risk, bond-heavy solutions outperformed their higher risk, equity-laden counterparts.
The top 8 low risk options all posted higher returns than the top-performing high risk solution, whilst Moneybox's Cautious option, which came bottom of the low risk table in all three timeframes, still outperformed 4 high risk options this quarter, including Moneybox's Adventurous option and Vanguard LifeStrategy 100.
Why did low risk options do so well? The main reason is bond exposure and the relationship between bonds and interest rates. When a government or company issues a bond, they are effectively taking a loan from the bond-holder, promising to repay them the full amount of the bond at the end of its term, as well as a 'coupon' every year as an incentive.
So for example, a 30-year 5% £1,000 bond issued by the government means that the UK government will pay the bond-holder 5% every year (£50), for the next 30 years, at which point it will repay the £1,000.
There is a secondary market for bonds - if I buy a 30-year UK government bond and don't want to wait 30 years to get my money, I can sell this bond to someone else who will take it off my hands.
Like any other financial instrument, bond prices can vary over time. Bond prices are particularly affected by interest rates, with bonds issued during periods of higher interest rates offering higher coupons to remain an attractive investment option. Coupon rates are usually fixed, which means when interest rates drop, the coupon rate is relatively high in comparison to what you can get elsewhere in the market, leading to increased demand for these bonds and raising its price.
This theory played out in reality during the past quarter, with both the UK and US cutting interest rates, leading to the strong performance seen in the low risk category in Q3.
Provider | Fund / Portfolio | Risk Level | Q3 2024 Net Growth 👇 | 1 Year net Growth | 2 Year Net Growth |
HSBC | Cautious | Low | 3.5% | 11.4% | 12.6% |
Halifax | Managed Growth 2 | Low | 3.2% | 12.8% | 18.0% |
Vanguard | LifeStrategy 20 | Low | 3.1% | 11.0% | 12.6% |
Hargreaves Lansdown | Cautious Managed | Low | 3.0% | 12.0% | 6.3% |
Aviva | Multi-asset Plus I | Low | 2.9% | 13.4% | 15.1% |
Charles Stanley | Multi Asset Cautious | Low | 2.7% | 10.6% | 14.3% |
Wealthify | Tentative | Low | 2.6% | 9.4% | 12.9% |
True Potential | Defensive | Low | 2.2% | 9.1% | 10.6% |
Santander | Multi-index Fund 1 | Low | 2.1% | 10.8% | 14.5% |
AJ Bell | Cautious | Low | 1.7% | 8.8% | 9.6% |
Moneybox | Cautious | Low | 0.9% | 5.2% | 3.6% |
Nutmeg | 2 | Low | - | 9.4% | 14.3% |
This table displays performance over multiple timeframes across the past 2 years for a range of investment funds/portfolios. Performance has been calculated net of investment and platform charges. Risk levels have been classified based on Boring Money’s parameters, which can be found in the ‘key terms’ and 'methodology' sections below. Performance figures have either come directly from platforms or been estimated using the value of fund assets, assuming frequent rebalancing.
Key terms

The investment provider offering and managing the fund/portfolio or ready-made solution (see definition below).
The name of the particular fund/portfolio held on the investment provider’s platform. This will typically include a mixture of cash, bonds, and shares at different proportions depending on your chosen risk level. All funds/portfolios included in this article can also be classified as ready-made solutions - which you can learn more about in our guide here.
Another name for 'shares' or 'stocks', equities are small slices of a company which investors can buy in order to invest in them. If the company does well, its equities will increase in value. If it doesn't, its equities will fall in value. Read our full guide here for more info.
Bonds are like IOUs between you and a company or government. You can lend them money by way of a loan and they pay you interest on this loan. This interest is called the bond 'yield' and the amount differs depending on how risky the loan is perceived to be - that is, how likely the borrower is to be unable to repay it. Bonds are usually considered to be lower risk investments and frequently feature in low and medium risk investment portfolios. You can read more about bonds here.
Boring Money assigns each ready-made solution to a risk level/category based on its equity allocation. For the purpose of this exercise, there are three risk levels. Investments with an equity exposure of under 40% are considered low risk, investments with an equity exposure between 40% - 70% are considered medium risk, and investments with an equity exposure above 70% are considered high risk. You can read more about risk levels and how to determine which is right for you here.
'3rd quarter'. The period between 1 July 2024 and 30 September 2024.
The total growth of a ready-made solution minus charges. Charges include both fees paid for managing the investment and fees paid for using the investment provider’s platform.