




Best performing ready-made solutions of January – March 2025
Discover which portfolios were top of the pops
By Boring Money
16 April, 2025
Every three months we get performance data from the leading ready-made investment portfolios made available to retail investors. We group these into three risk categories and take a look at who has performed best over various timeframes after all fees and charges have been taken into account.
Important stuff: Our content is aimed to help readers’ understanding but it does not constitute any form of advice or recommendation. Investing is a long-term process, and shorter-term performance information alone won’t support robust choices. Investments can and will go up and down in value.
Click to reveal the full results
How did ready-made solutions perform in Q1 2025?
Ready-made solutions, much like the rest of the market, had a tough start to the year, with the average portfolio in this content series returning negative growth over Q1 2025. A sign of poor market performance is that higher risk categories typically do worse than their lower risk counterparts, which is something we definitely saw this quarter. This is because higher risk portfolios usually have a higher exposure to shares, which are seen as more volatile than lower risk assets like bonds. In essence, this means they yield fruit in good times, but generally are more vulnerable to damage in choppier waters.
The average high risk portfolio returned -3.0%, whilst the average medium risk portfolio returned -1.2%. Low risk portfolios did comparatively well, however the average was still just about negative, with a return of -0.1%. Overall, only 5 of the 31 portfolios we track returned positive growth in the quarter, with the best performing of these growing by a meagre 0.6%. But to put that in perspective, the worst performing portfolio over the period sank as much as -5.5%.

Average performance of each risk category
The table below illustrates the average performance of ready-made solutions from the three risk categories - high, medium and low - across the different time periods we track:
Risk Level | Q1 2025 AVERAGE NET GROWTH | 1 YEAR AVERAGE NET GROWTH | 2 YEAR AVERAGE NET GROWTH | 5 YEAR AVERAGE NET GROWTH |
High Risk | -3.0% | 3.7% | 20.3% | 72.0% |
Medium Risk | -1.2% | 3.4% | 14.3% | 38.1% |
Low Risk | -0.1% | 2.9% | 9.2% | 14.5% |
Disclaimer: Investing is a long-term process, and investment decisions must not be based solely on past performance, especially over short timeframes.
High risk ready-made solutions
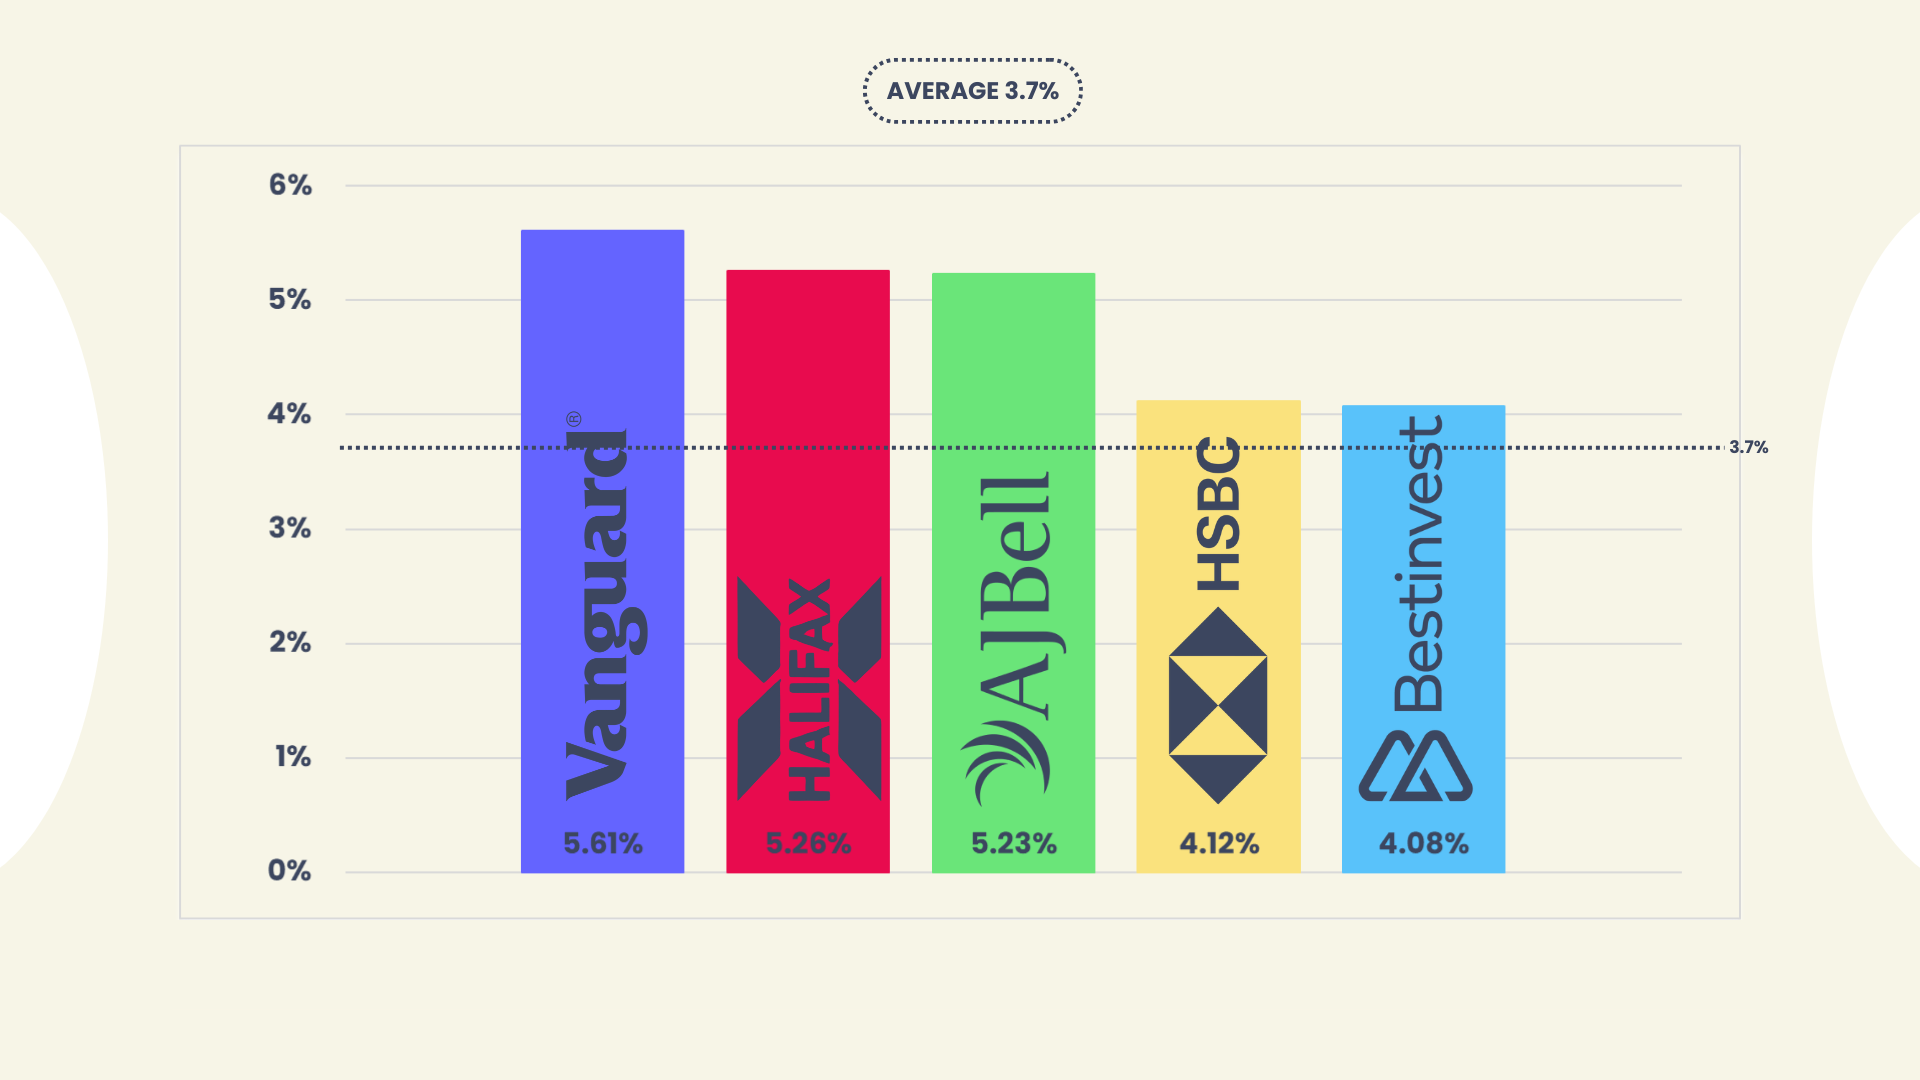
Graph illustrating net returns for one year covering April 2024 - March 2025 of the top 5 performing ready-made solutions against the average of all of the high risk funds/portfolios covered in our analysis. Data correct as at 31st March 2025. Returns calculated net of charges. The full fund/portfolio names can be found in the table below.
Vanguard LifeStrategy 100% is the top performer across the 1-year, 2-year and 5-year periods. However, when looking at a shorter timeframe, AJ Bell's solution performed best in the category, despite all high risk solutions posting negative returns for the quarter.
Whilst President Trump's tariffs and the ensuing madness of the past couple of weeks has dominated headlines and affected portfolios globally, the looming threat had already started to make an impact earlier in Q1. The S&P 500 had negative returns over the quarter for the first time since Q3 2023 - although the FTSE 100 had a much better start to the year, growing by roughly 6%.
The average high risk portfolio in this content series returned -3.1% over Q1, with all providers showing negative performance over the period. AJ Bell did the best, with a loss of -0.3%, whilst Aviva and Moneybox had the weakest quarterly performance in this category with returns below -5%. One reason for AJ Bell's relative success this quarter is the regional allocation of the fund, with 23% invested in the UK, 23% in the US, and 12% in the Eurozone. The UK proportion is higher than we see in other funds, whilst the US allocation is lower. This has served AJ Bell well so far in 2025, particularly in light of the struggles and uncertainty around the US economy since Trump returned to office.
Looking over a longer period, Vanguard have been the standout performers, topping the list across 1-year, 2-year, and 5-year timeframes. 1-year returns have been modest, with the average portfolio growing by 3.7%, although this jumps to 20.3% when looking over two years, and 72% when covering a 5-year period. Vanguard's LifeStrategy 100 boasts 89% growth in the last five years, meaning a £10,000 investment made on 1 April 2020 would have been worth £18,900 as of the end of March 2025.
This is a welcome reminder of the adage, "time in the market is better than timing the market"; Investing with a long-term focus tends to pay off. It also helps psychologically to deal with market volatility when you've seen some growth in your initial investment. For first-time investors, don't panic! History has shown that the stock market trends upward in the long run, even if there are bumps along the way.
Provider | Fund / Portfolio | Risk Level | Q1 2025 Net Growth 👇 | 1 Year Net Growth | 2 Year Net Growth | 5 Year Net Growth |
Nutmeg | 10 | High | - | 3.2% | 20.4% | 80.1% |
AJ Bell | Adventurous | High | -0.3% | 5.2% | 18.1% | 78.3% |
Halifax | Managed Growth 6 | High | -1.0% | 5.3% | 19.1% | 55.2% |
Bestinvest | Smart Maximum Growth | High | -1.6% | 4.1% | 18.3% | N/A |
Vanguard | LifeStrategy 100 | High | -2.4% | 5.6% | 24.2% | 89.0% |
Wealthify | Adventurous | High | -3.0% | 3.5% | 17.6% | 59.4% |
Charles Stanley | Multi Asset Adventurous | High | -3.6% | 2.7% | 16.1% | 49.9% |
HSBC | Adventurous | High | -3.9% | 4.1% | 23.5% | 78.5% |
Hargreaves Lansdown | Adventurous Managed | High | -4.1% | 1.9% | 20.2% | N/A |
Aviva | Multi-asset Plus V | High | -5.0% | 3.4% | 23.1% | 79.3% |
Moneybox | Adventurous | High | -5.5% | 2.4% | 22.4% | 78.3% |
This table displays performance over multiple timeframes across the past 5 years for a range of investment funds/portfolios. Performance has been calculated net of investment and platform charges. Risk levels have been classified based on Boring Money’s parameters, which can be found in the ‘key terms’ and 'methodology' sections below. Performance figures have either come directly from platforms or been estimated using the value of fund assets, assuming frequent rebalancing.
Medium risk ready-made solutions
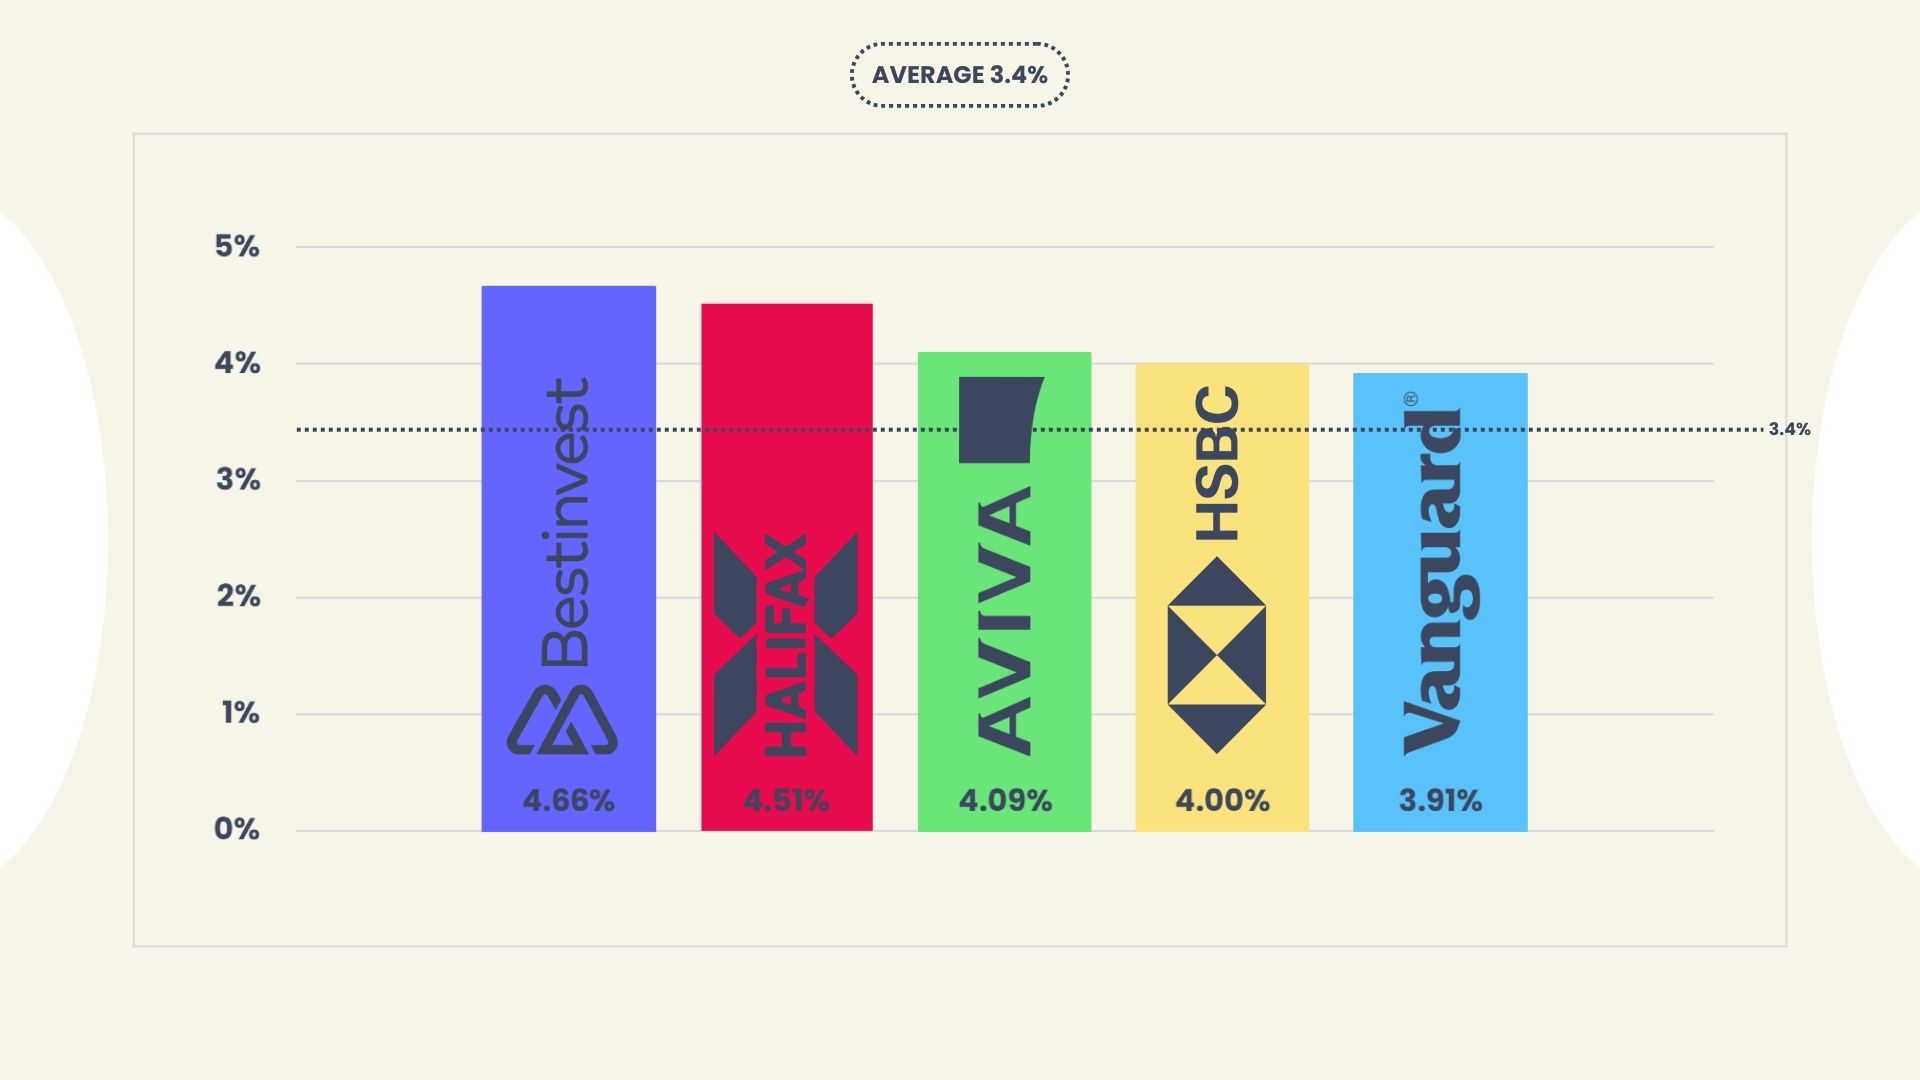
Graph illustrating net returns for one year covering April 2024 - March 2025 of the top 5 performing ready-made solutions against the average of all of the medium risk funds/portfolios covered in our analysis. Data correct as at 31st March 2025. Returns calculated net of charges. The full fund/portfolio names can be found in the table below.
Bestinvest's Balanced fund is the only one in this risk category to not post negative returns over the quarter - the solution is also the top performer when looking at a 1-year timeframe.
The average medium risk portfolio returned -1.2% in Q1, with Bestinvest being the standout performer over this period and the only provider to not register negative growth after fees. Bestinvest are also the best performer over the last year, returning 4.7%, in comparison to the average of 3.4%. Over longer timeframes, the story changes, with HSBC coming to the fore as the top performer over two years and a close second over the 5-year period. HSBC's 2-year performance of 17.2% is over 3% higher than the rest of market's 14% average, and the portfolio has grown by 45.2% in the last 5 years, only slightly trailing AJ Bell's Balanced fund which tops the list with 45.6%.
A key driver behind Bestinvest's relative success this quarter has been its choice to opt for an equal-weighted exposure to the S&P 500, instead of opting for a standard S&P 500 ETF which is split by market capitalisation.
To explain this idea, imagine 3 companies: Company A is worth £70m, Company B is £20m, and Company C is worth £10m. An ETF made up of the 3 companies which is split by market capitalisation would be made up of 70% of Company A, 20% of Company B, and 10% of Company C. That means that any change in the value of Company A would have a bigger impact on the ETF than the same change in the value of Company B or C. An equal-weighted ETF of the 3 companies would have a fair split of 33.33% in A, B, and C.
The reason this is important is because there have been growing concerns at the concentration of the “Magnificent 7" in the S&P 500, with the fortunes of the index increasingly impacted by the performance of these 7 stocks. After bumper years in 2023 and 2024 for tech firms, and more modest returns across the rest of the sectors, Trump's tariffs have since hit US tech firms like Apple, Amazon, and Nvidia the hardest - leading to large falls across the sector and the S&P 500 in turn. The impact of large declines in the share price of these companies is partially mitigated by an equal-weighted ETF, as the companies make up a smaller proportion of the overall portfolio.
In contrast, Nutmeg's Fully-Managed Portfolio 6 has close to 30% in the S&P 500, split between different ETFs. None of these are equally weighted, meaning there is a significant exposure to leading tech companies, which has had a negative impact on its performance in recent months. There is additional nuance to Nutmeg's S&P 500 exposure, with Nutmeg allocating a significant proportion into GBP hedged ETFs. This reduces the impact of weakness in the foreign currency and has helped protect Nutmeg investors from some of the falls in the US dollar's strength over the second half of Q1.
Provider | Fund / Portfolio | Risk Level | Q1 2025 Net Growth 👇 | 1 Year net Growth | 2 Year Net Growth | 5 Year Net Growth |
Nutmeg | 6 | Medium | - | 1.5% | 12.6% | 32.9% |
Bestinvest | Smart Balanced | Medium | 0.0% | 4.7% | 13.8% | N/A |
Halifax | Managed Growth 4 | Medium | -0.4% | 4.5% | 15.9% | 36.2% |
AJ Bell | Balanced | Medium | -0.8% | 2.3% | 11.7% | 45.6% |
Vanguard | LifeStrategy 60 | Medium | -1.1% | 3.9% | 15.2% | 40.3% |
Hargreaves Lansdown | Balanced Managed | Medium | -1.2% | 3.0% | 14.5% | N/A |
Aviva | Multi-asset Plus II | Medium | -1.3% | 4.1% | 15.6% | 34.6% |
Charles Stanley | Multi Asset Moderate | Medium | -1.7% | 2.6% | 12.1% | 27.7% |
Wealthify | Ambitious | Medium | -1.9% | 3.4% | 14.0% | 41.8% |
HSBC | Balanced | Medium | -2.0% | 4.0% | 17.2% | 45.2% |
This table displays performance over multiple timeframes across the past 5 years for a range of investment funds/portfolios. Performance has been calculated net of investment and platform charges. Risk levels have been classified based on Boring Money’s parameters, which can be found in the ‘key terms' and 'methodology' sections below. Performance figures have either come directly from platforms or been estimated using the value of fund assets, assuming frequent rebalancing.
Low risk ready-made solutions
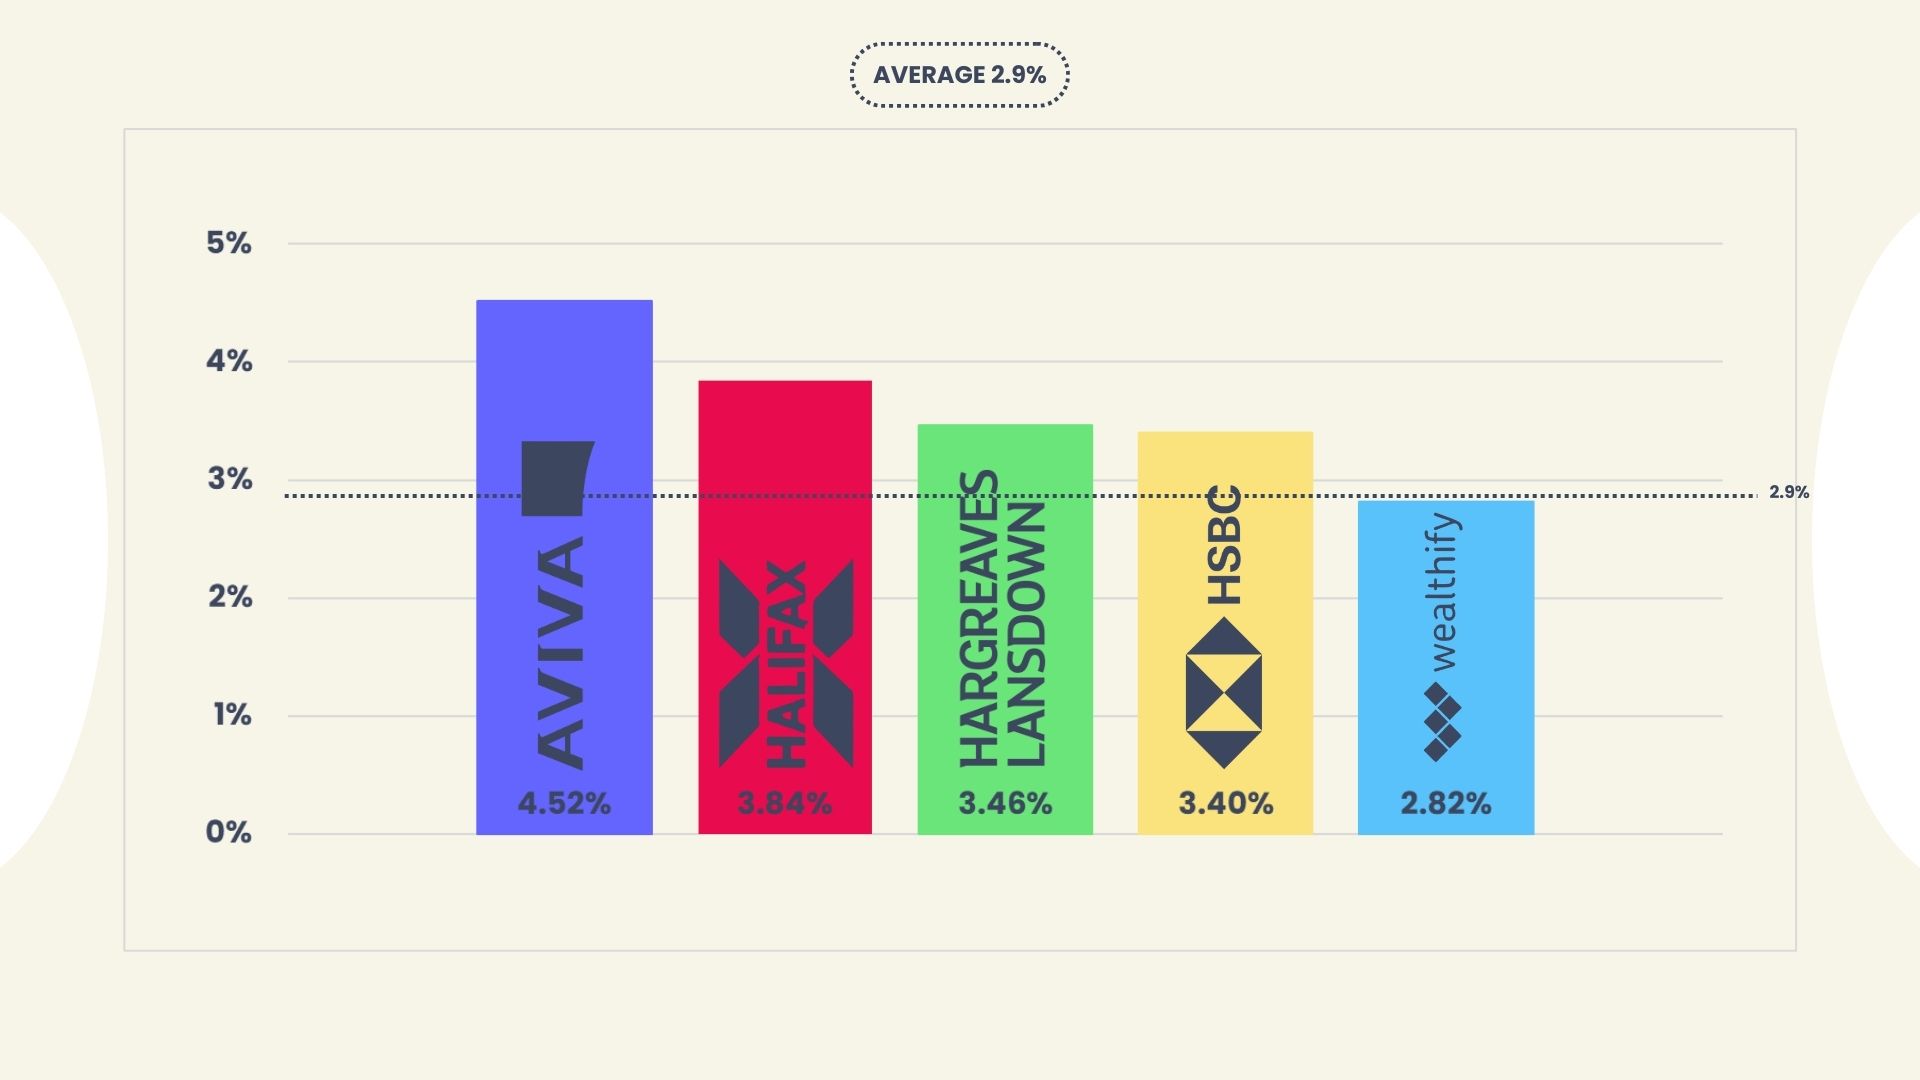
Graph illustrating net returns for one year covering April 2024 - March 2025 of the top 5 performing ready-made solutions against the average of all of the low risk funds/portfolios covered in our analysis. Data correct as at 31st March 2025. Returns calculated net of charges. The full fund/portfolio names can be found in the table below.
Hargreaves Lansdown's low risk solution is in the top 5 performers across all timeframes covered, and is the only fund in this category to post returns in excess of 20% over 5 years after taking fees into account.
The average low risk portfolio returned -0.1% in Q1, which is 2.9% more than the average high risk portfolio over the period. There was a range of 1.5% between the top and bottom in the low risk category, with Aviva (0.6%) and Halifax (0.4%) performing the best, whilst AJ Bell (-0.7%) and Moneybox (-0.9%) were at the bottom. There was a 50/50 split between providers that generated positive and negative returns in the quarter, however all 10 portfolios had positive growth across the longer 1-year, 2-year, and 5-year timeframes.
Average returns across the last 12 months were 2.9%, jumping up to 9.2% across a 2-year period and a more modest 14.5% across the full five years. Aviva and Halifax take pole positions across the shorter timeframes, whilst Hargreaves Lansdown are a clearer winner over five years, returning 28% over the period - over 9% higher than Charles Stanley in second place.
Halifax's fund has had positive performance in 4 of the last 5 calendar years, although 2022 hit the bond market badly, with rising interest rates and Liz Truss' mini-budget causing a poor year for gilts. As of the end of 2024, Halifax hold roughly 35% of their fund in UK fixed-income, larger than the 32% allocated to bonds from the rest of the world. Aviva, on the other hand, favour US bonds, with 45% of fixed-income assets allocated to the region, followed by 15% in the UK and 8% in Japan.
Hargreaves Lansdown have roughly 40% allocated to North America, 20% in Developed Europe, and 10% in the UK. The largest holding in the portfolio is a HL Global Corporate Bond fund, closely followed by a Global Government Bond index, with the two accounting for 50% of the fund's assets.
Provider | Fund / Portfolio | Risk Level | Q1 2025 Net Growth 👇 | 1 Year net Growth | 2 Year Net Growth | 5 Year Net Growth |
Nutmeg | 2 | Low | - | 2.4% | 9.0% | 10.1% |
Aviva | Multi-asset Plus I | Low | 0.6% | 4.5% | 12.7% | 14.6% |
Halifax | Managed Growth 2 | Low | 0.4% | 3.8% | 12.2% | 16.2% |
Vanguard | LifeStrategy 20 | Low | 0.2% | 2.5% | 7.5% | 4.9% |
Hargreaves Lansdown | Cautious Managed | Low | 0.1% | 3.5% | 10.1% | 28.0% |
Wealthify | Tentative | Low | 0.1% | 2.8% | 7.6% | 11.8% |
HSBC | Cautious | Low | 0.0% | 3.4% | 9.4% | 9.1% |
Charles Stanley | Multi Asset Cautious | Low | -0.6% | 2.5% | 9.2% | 18.7% |
AJ Bell | Cautious | Low | -0.7% | 0.8% | 7.1% | 16.5% |
Moneybox | Cautious | Low | -0.9% | 2.3% | 7.6% | 14.7% |
This table displays performance over multiple timeframes across the past 5 years for a range of investment funds/portfolios. Performance has been calculated net of investment and platform charges. Risk levels have been classified based on Boring Money’s parameters, which can be found in the ‘key terms’ and 'methodology' sections below. Performance figures have either come directly from platforms or been estimated using the value of fund assets, assuming frequent rebalancing.
Disclaimer: Investing is a long-term process, and investment decisions must not be based solely on past performance, especially over short timeframes.
Key terms
Provider
The investment provider offering and managing the fund/portfolio or ready-made solution (see definition below).
Fund/Portfolio
The name of the particular fund/portfolio held on the investment provider’s platform. This will typically include a mixture of cash, bonds, and shares at different proportions depending on your chosen risk level. All funds/portfolios included in this article can also be classified as ready-made solutions - which you can learn more about in our guide here.
Equities
Another name for 'shares' or 'stocks', equities are small slices of a company which investors can buy in order to invest in them. If the company does well, its equities will increase in value. If it doesn't, its equities will fall in value. Read our full guide here for more info.
Bonds
Bonds are like IOUs between you and a company or government. You can lend them money by way of a loan and they pay you interest on this loan. This interest is called the bond 'yield' and the amount differs depending on how risky the loan is perceived to be - that is, how likely the borrower is to be unable to repay it. Bonds are usually considered to be lower risk investments and frequently feature in low and medium risk investment portfolios. You can read more about bonds here.
Risk Level/Category
Boring Money assigns each ready-made solution to a risk level/category based on its equity allocation. For the purpose of this exercise, there are three risk levels. Investments with an equity exposure of under 40% are considered low risk, investments with an equity exposure between 40% - 70% are considered medium risk, and investments with an equity exposure above 70% are considered high risk. You can read more about risk levels and how to determine which is right for you here.
Q1 2025
'1st quarter'. The period between 1 January 2025 and 31 March 2025.
Net Growth
The total growth of a ready-made solution minus charges. Charges include both fees paid for managing the investment and fees paid for using the investment provider’s platform.
Boring Money selects one ready-made solution per provider for each risk category (see definition above). If a provider has more than one suitable ready-made option within a particular risk category, the option selected is the one with an equity allocation closest to a pre-determined exposure level, as shown below:
High risk - 100%
Medium risk - 60%
Low risk - 20%





Post a comment:
This is an open discussion and does not represent the views of Boring Money. We want our communities to be welcoming and helpful. Spam, personal attacks and offensive language will not be tolerated. Posts may be deleted and repeat offenders blocked at our discretion.
Your opinion matters
Be the first to comment.