



Best-selling funds, Investment Trusts and ETFs of September 2026
Discover the most popular investments on the UK's top platforms
Written by Cherry Reynard
9 Oct, 2026
Every month, Boring Money conducts rigorous research on what the best-selling investments were across the UK's major investment platforms - including AJ Bell, Fidelity, Hargreaves Lansdown and interactive investor.
Boring Money's expert analysis
The backdrop for global stock markets took an uncomfortable turn in September. The war in Iran reignited and oil moved back above $100 a barrel. This prompted a quick and extreme response from bond markets, with The annual return an investor expects from a bond investment. rising rapidly over the month. This poses a threat to government finances and to economic stability, yet equity markets kept calm and carried on.
The A global index that tracks large and medium-sized companies from 23 developed countries around the world. fell just 1.2% over the month. The technology sector continued to dominate, with the Nasdaq Composite rising 1.9%. Investors appeared to see it as a safe haven, while other markets were Describes the price movement of an investment or index. High volatility indicates frequent and significant price movement, whereas low volatility denotes less frequent or severe fluctuations in price.. Smaller companies struggled against the rising cost of borrowing, and the Tracks the performance of 2,000 small-cap companies listed on U.S. stock exchanges. was the weakest segment in US markets, falling 5.3%.
The energy sector benefited from renewed rises in oil prices. Brent Crude peaked at $109 mid-month, with no end to the Iran conflict in sight. Some shipping is passing through the Strait of Hormuz, but only at 75-80% of normal, pre-war volumes. Healthcare also showed resilience over the month.
The weak spots were interest rate-sensitive sectors such as real estate. Financials also had a difficult month. Usually, banks and insurers are beneficiaries of higher borrowing costs, but the rapid moves in bond markets threatened to destabilise the smooth financing environment that has boosted earnings since the start of the year. Higher borrowing costs could also depress demand for corporate and consumer loans. The sell-off hit areas such as private equity and asset management particularly hard.
Emerging markets also proved resilient, with the MSCI Emerging Markets index falling just 0.6% over the month. Index heavyweights such as TSMC, Samsung and SK Hynix continued to motor higher, supported by ongoing strength in AI infrastructure spending. Emerging markets may have had to contend with a stronger dollar, but they did not face the same bond crisis engulfing many developed nations.
The US 10-year Treasury yield rose over 0.8 percentage points over the month, tipping over the psychologically significant 5% mark to reach 5.3%. It was a phenomenon seen across highly indebted financial markets. Japan’s ten-year yield rose around 0.4%, and the UK’s rose around 0.25%. The biggest single casualty was France, where out-of-control borrowing and protests against spending cuts threatened to destabilise the government.
There were some interventions from policymakers. Treasury secretary Scott Bessent started using government funds to buy longer-dated government bonds, but this had little impact on the market. Conditions improved a little after the The central bank of the United States, responsible for setting American interest rates and managing the money supply. Its decisions ripple far beyond US borders — when the Fed raises or cuts rates, it affects the dollar, global borrowing costs, and asset prices from bonds to gold worldwide. Often shortened to "the Fed." raised interest rates by 0.25%. This restored faith in the central bank’s credibility and calmed investor nerves. In the UK, the Bank of England pared back its quantitative tightening scheme, reducing the sale of gilts onto the market.
However, these interventions cannot mask the underlying reality driving bond markets. Term used to describe how quickly the prices of goods and services is rising over a period of time. In periods of high inflation, prices are increasing rapidly, whereas low inflation means prices are increasing by only a small amount. is high, government debt is huge and there is new competition as the US technology giants issue debt to fund their AI build-out. Few global governments seem willing to take any action to tackle their deficits. Bond markets may ultimately force action upon them.
The biggest question is whether the turmoil in bond markets spills over into stock markets. This is possible. The US technology giants are borrowing to raise capital for AI spending and, while a percent or two on the cost of borrowing may not matter very much, they will have limits. In this way, higher bond yields could have a knock-on effect on the AI boom.
When prices are rising or are expected to rise - for example, during a recovery after a recession. The widely accepted point at which it becomes a bull market is when a large proportion of share prices rise 20% or more.are often unseated by higher borrowing costs. Stock markets can’t remain indifferent to bond market turmoil indefinitely. Unless there is some resolution to the war in Iran, this may be the defining factor for markets in the final few months of 2026.
Best-selling funds | September 2026
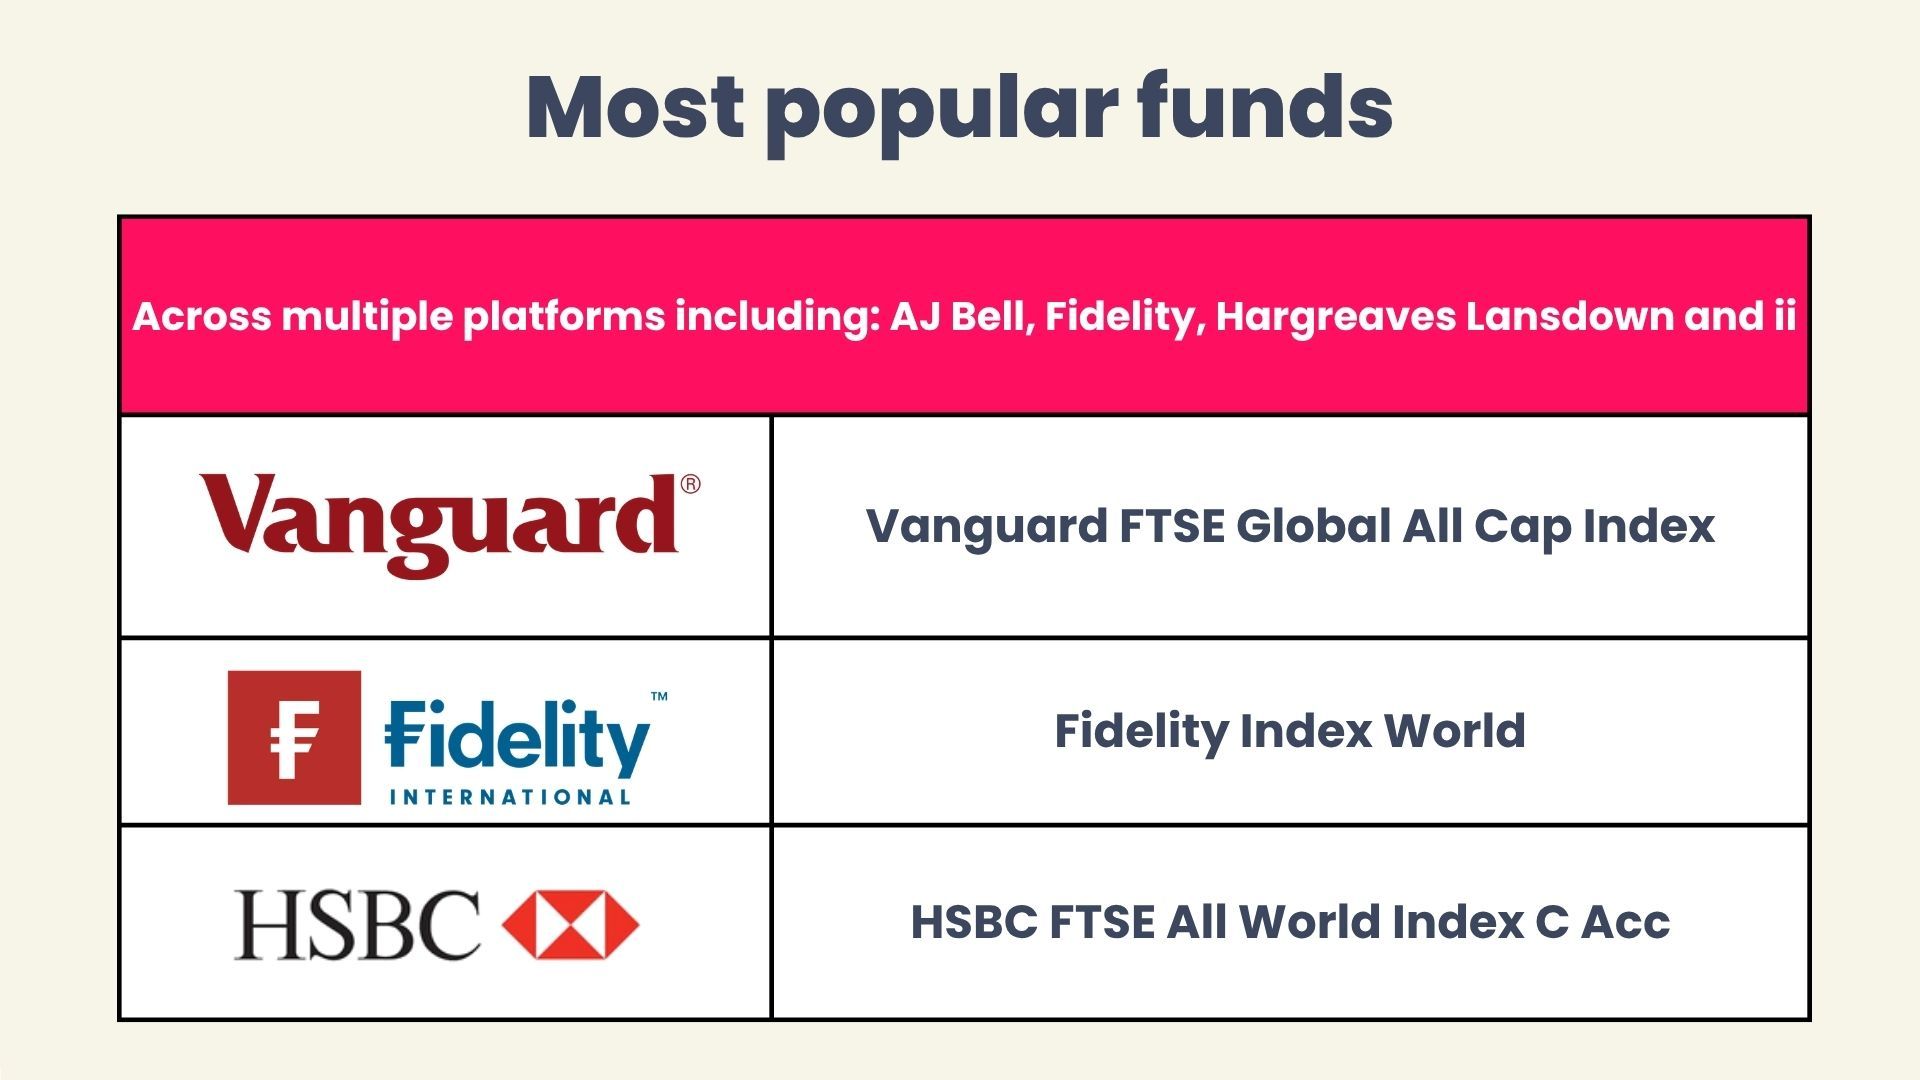
The most popular funds across multiple platforms, including AJ Bell, Fidelity, Hargreaves Lansdown and interactive investor were Vanguard FTSE Global All Cap Index, Fidelity Index World and HSBC FTSE All World Index C Acc.
If investors were worried about the rising risks in global financial markets, they weren’t showing it in their buying habits in September. Although cash funds were the best-selling option on the Fidelity and ii platforms, there was plenty of appetite for riskier assets.
On the AJ Bell platform, the most popular option was its in-house ‘Adventurous’ fund, which was noticeably ahead of its ‘Moderately Adventurous’ and ‘Balanced’ options. It was a similar picture on the Hargreaves Lansdown platform with its ‘Growth’ fund beating its ‘Moderately Adventurous’ and ‘Adventurous Managed’ options. On the ii platform, the Vanguard LifeStrategy 80% Equity just pipped the Vanguard LifeStrategy 100% Equity.
Elsewhere, investors were sticking with The process of spreading your investment portfolio across different asset classes, such as partially in shares and partially in bonds, in order to reduce risk. global index funds. The most popular funds across all four platforms were the Vanguard FTSE Global All Cap index, Fidelity Index World and HSBC FTSE All World Index, the same as last month. These funds all have significant weightings in the US and in the technology sector, both of which proved resilient in September.
That said, the enthusiasm for specialist technology funds was less in evidence than it was earlier in the year. Only one - L&G Global Technology Index Trust – appeared on any platform this month. Similarly, investors appeared to be losing their enthusiasm for An index that tracks the performance of the 500 largest publicly traded companies in the United States. It's often used as a benchmark for the overall global stock market. trackers and US-specialist investment. Only two funds – the UBS S&P 500 Index and Legal & General US Index funds – made the best seller lists.
The same active funds featured this month as in August. The Artemis Global Income fund appeared on the Fidelity and ii platforms, while the Fidelity Special Situations fund was a rare UK-focused fund on the best-seller lists.
Best-selling funds from AJ Bell
Fund | 3 year performance | 5 year performance | OCF | Sector |
AJ Bell Adventurous I Acc | 56.8% | 67.4% | 0.31% | Flexible Investment |
AJ Bell Moderately Adv I Acc | 46.7% | 51.3% | 0.31% | Mixed Investment 40-85 |
Vanguard FTSE Global All Cp Idx £ Acc | 63.0% | 70.9% | 0.23% | Global |
AJ Bell Global Growth I Acc | 58.4% | 65.3% | 0.31% | Flexible Investment |
HSBC FTSE All-World Index C Acc | 66.2% | 75.1% | 0.13% | Global |
AJ Bell Balanced I Acc | 37.7% | 40.1% | 0.31% | Mixed Investment 40-85 |
Fidelity Index World P Acc | 64.8% | 77.5% | 0.12% | Global |
Vanguard LifeStrategy 100% Equity A Acc | 63.3% | 73.6% | 0.20% | Global |
AJ Bell Responsible Scrn Gr I GBP Acc | 45.7% | 41.5% | 0.45% | Flexible Investment |
Vanguard LifeStrategy 80% Equity A Shares Acc in GB | 50.9% | 51.8% | 0.20% | Mixed Investment 40-85 |
Performance figures are retrieved from FE FundInfo on a Total Return is a comprehensive way of measuring investment performance that includes two components: capital appreciation/depreciation (changes in the actual price or value of the investment) and income distributions (any dividends, interest payments, or other distributions paid out during the measurement period)..
Best-selling funds from Fidelity
Fund | 3 year performance | 5 year performance | OCF | Sector |
Fidelity Cash Fund Acc | 14.4% | 19.7% | 0.15% | Short Term Money Market |
Royal London Short Term Money Market Fund Acc | 14.7% | 20.2% | 0.10% | Short Term Money Market |
Fidelity Index World Fund | 64.8% | 77.5% | 0.12% | Global |
Vanguard FTSE Glbl All Cap Idx GBP Acc | 63.0% | 70.9% | 0.23% | Global |
HSBC FTSE All World Index C Acc | 66.2% | 75.1% | 0.13% | Global |
Fidelity Special Situations W-Acc | 71.1% | 77.2% | 0.91% | UK All Companies |
Legal & General Glbl Equity Index I Acc | 69.5% | 82.7% | 0.13% | Global |
Artemis Global Income I Acc | 135.6% | 160.8% | 0.83% | Global Equity Income |
Fidelity Index US Fund P-Acc | 69.0% | 88.3% | 0.06% | North America |
Lazard Emerging Markets A Acc | 96.9% | 104.4% | 1.04% | Global Emerging Market |
Performance figures are retrieved from FE FundInfo on a Total Return is a comprehensive way of measuring investment performance that includes two components: capital appreciation/depreciation (changes in the actual price or value of the investment) and income distributions (any dividends, interest payments, or other distributions paid out during the measurement period)..
Best-selling funds from Hargreaves Lansdown
Fund | 3 year performance | 5 year performance | OCF | Sector |
HL Growth Fund | 55.2% | N/A | 0.87% | Volatility Managed |
Vanguard FTSE Global All Cap Index | 63.0% | 70.9% | 0.23% | Global |
HL Multi-Index Moderately Adventurous (Class D) | N/A | N/A | 0.87% | Volatility Managed |
HL Adventurous Managed | 54.8% | N/A | 0.87% | Volatility Managed |
Fidelity Index World | 64.8% | 77.5% | 0.12% | Global |
L&G International Index Trust C Acc in GB* | 70.4% | 83.6% | 0.08% | Global |
HL Moderately Adventurous Managed | 45.5% | N/A | 0.87% | Volatility Managed |
HSBC FTSE All World Index C Acc | 66.2% | 75.1% | 0.13% | Global |
UBS S&P 500 Index | 69.1% | 90.8% | 0.09% | North America |
Legal & General US Index | 69.4% | 86.7% | 0.10% | North America |
Performance figures are retrieved from FE FundInfo on a Total Return is a comprehensive way of measuring investment performance that includes two components: capital appreciation/depreciation (changes in the actual price or value of the investment) and income distributions (any dividends, interest payments, or other distributions paid out during the measurement period)..
Best-selling funds from interactive investor
Fund | 3 year performance | 5 year performance | OCF | Sector |
Royal London Short Term Money Market (Acc) | 14.7% | 20.2% | 0.10% | Short Term Money Market |
Vanguard FTSE Global All Cp Idx £ Acc | 63.0% | 70.9% | 0.23% | Global |
HSBC FTSE All-World Index C Acc | 66.2% | 75.1% | 0.13% | Global |
Artemis Global Income I Acc | 135.6% | 160.8% | 0.83% | Global Equity Income |
Vanguard LifeStrategy 80% Equity | 50.9% | 51.8% | 0.20% | Mixed Investment 40-85 |
Vanguard LifeStrategy 100% Equity A Acc | 63.3% | 73.6% | 0.20% | Global |
Vanguard LifeStrategy 60% Equity A Acc | 39.3% | 32.7% | 0.20% | Mixed Investment 40-85 |
L&G Global Technology Index Trust | 141.9% | 168.9% | 0.31% | Technology & Technology Innovation |
Fidelity Index World | 64.8% | 77.5% | 0.12% | Global |
Royal London Short Term Money Mkt Y Inc | 14.6% | 20.2% | 0.10% | Short Term Money Market |
Performance figures are retrieved from FE FundInfo on a Total Return is a comprehensive way of measuring investment performance that includes two components: capital appreciation/depreciation (changes in the actual price or value of the investment) and income distributions (any dividends, interest payments, or other distributions paid out during the measurement period)..
Data provided by FE FundInfo, correct as at 30 September 2026.
Best-selling Investment Trusts | September 2026
The most popular Investment Trusts across AJ Bell, Fidelity, Hargreaves Lansdown, and interactive investor were Scottish Mortgage, Polar Capital Technology, City of London and Greencoat UK Wind.

Investment Trust investors continue to show that there is a place for boring but consistent funds this month. The City of London Trust celebrated 60 years of year-on-year A cash bonus shareholders get in return for investing in something. Dividends can be paid out on a monthly, biannual or annual basis. growth this month, generated from a portfolio of UK-listed blue chips. Its popularity shows no signs of fading: it was a top seller on all four platforms and the best seller on AJ Bell.
It is a perfect foil to Scottish Mortgage and Polar Capital Technology, which also appeared on all four platforms. Both Trusts showed resilient performance over the month as the strength of the technology sector showed no sign of ebbing. There is still no official date for the Anthropic IPO and the company has suffered a reputational hit from AI’s ‘rogue agent’ problem (even though these largely came from ChatGPT). Nevertheless, when it finally lists, it could be another payday for Scottish Mortgage, which has a 2.8% stake.
The other popular Trust was Greencoat UK Wind. The 9.5% dividend continues to have appeal for UK investors. Performance has been improving for the Trust as governments and the corporate sector have refocused on alternative sources of energy in the wake of a second energy crisis in five years. The Trust recently reported its best first-half returns since 2022. The Renewables Infrastructure Group also benefited from this reappraisal of the energy sector.
Income continues to be a priority for Investment Trust investors, Tritax Big Box Reit, which invests in logistics warehouses and has a yield of 5.7%, appeared on three of the four platforms, while Schroder Real Estate Investment Trust (8.9% yield) was a top seller on the ii platform. The JP Morgan Growth & Income appeared on three out of four platforms despite the announcement of the retirement of lead manager Helge Skibeli. Henderson Far East Income, with its 9.2% dividend yield, was also a popular choice.
Best-selling Investment Trusts from AJ Bell
Investment Trust | 3 year performance | 5 year performance | OCF | Sector |
City of London Ord | 63.5% | 85.1% | 0.36% | UK Equity Income |
Greencoat UK Wind | 7.7% | 28.9% | 1.03% | Renewable Energy Infrastructure |
Scottish Mortgage Ord | 140.7% | 13.9% | 0.33% | Global |
Temple Bar Investment Trust | 97.4% | 137.1% | 0.62% | UK Equity Income |
Henderson Far East Income | 70.8% | 50.8% | 1.12% | Asia Pacific Equity Income |
Polar Capital Technology Ord | 214.2% | 189.1% | 0.69% | Technology & Technology Innovation |
JPMorgan Global Growth & Income Ord | 49.2% | 68.1% | 0.44% | Global Equity Income |
Tritax Big Box Reit PLC | 19.1% | -16.2% | 0.86% | Property - UK Logistics |
TwentyFour Select Monthly Income | 22.4% | 13.0% | 1.21% | Debt - Loans & Bonds |
Jpmorgan European Growth & Income | 83.4% | 102.8% | 0.66% | Europe |
Performance figures are retrieved from FE FundInfo on a Total Return is a comprehensive way of measuring investment performance that includes two components: capital appreciation/depreciation (changes in the actual price or value of the investment) and income distributions (any dividends, interest payments, or other distributions paid out during the measurement period)..
Best-selling Investment Trusts from Fidelity
Investment Trust | 3 year performance | 5 year performance | OCF | Sector |
Scottish Mortgage Investment Trust | 140.7% | 13.9% | 0.33% | Global |
City of London Ord | 63.5% | 85.1% | 0.36% | UK Equity Income |
Fidelity China Special Situations | 32.9% | -7.4% | 0.92% | China/Greater China |
International Public Partnership | 35.1% | 14.7% | 1.11% | Infrastructure |
Polar Capital Technology Trust PLC | 214.2% | 189.1% | 0.69% | Technology & Technology Innovation |
Temple Bar Investment Trust | 97.4% | 137.1% | 0.62% | UK Equity Income |
Greencoat UK Wind | 7.7% | 28.9% | 1.03% | Renewable Energy Infrastructure |
Schroder Japan Trust | 91.3% | 111.8% | 0.92% | Japan |
Law Debenture Corporation | 71.7% | 96.0% | 0.49% | UK Equity Income |
Fidelity Special Values PLC | 89.0% | 86.1% | 0.68% | UK All Companies |
Performance figures are retrieved from FE FundInfo on a Total Return is a comprehensive way of measuring investment performance that includes two components: capital appreciation/depreciation (changes in the actual price or value of the investment) and income distributions (any dividends, interest payments, or other distributions paid out during the measurement period)..
Best-selling Investment Trusts from Hargreaves Lansdown
Investment Trust | 3 year performance | 5 year performance | OCF | Sector |
Scottish Mortgage | 140.7% | 13.9% | 0.33% | Global |
City of London | 63.5% | 85.1% | 0.36% | UK Equity Income |
F&C Investment Trust | 63.2% | 72.8% | 0.45% | Global |
Greencoat UK Wind | 7.7% | 28.9% | 1.03% | Renewable Energy Infrastructure |
Alliance Witan plc Ordinary 2.5p Shares | 42.4% | 52.7% | 0.62% | Global |
JPMorgan Global Growth & Income Ord | 49.2% | 68.1% | 0.44% | Global Equity Income |
Polar Capital Technology Trust plc | 214.2% | 189.1% | 0.69% | Technology & Technology Innovation |
Law Debenture Corporation | 71.7% | 96.0% | 0.49% | UK Equity Income |
Henderson Far East Income | 70.8% | 50.8% | 1.12% | Asia Pacific Equity Income |
Tritax Big Box Reit PLC | 19.1% | -16.2% | 0.86% | Property - UK Logistics |
Performance figures are retrieved from FE FundInfo on a Total Return is a comprehensive way of measuring investment performance that includes two components: capital appreciation/depreciation (changes in the actual price or value of the investment) and income distributions (any dividends, interest payments, or other distributions paid out during the measurement period)..
Best-selling Investment Trusts from interactive investor
Investment Trust | 3 year performance | 5 year performance | OCF | Sector |
Scottish Mortgage | 140.7% | 13.9% | 0.33% | Global |
Greencoat UK Wind | 7.7% | 28.9% | 1.03% | Renewable Energy Infrastructure |
Polar Capital Technology | 214.2% | 189.1% | 0.69% | Technology & Technology Innovation |
City of London | 63.5% | 85.1% | 0.36% | UK Equity Income |
Henderson Far East Income | 70.8% | 50.8% | 1.12% | Asia Pacific Equity Income |
Schroder Real Estate Invest Ord | 19.0% | 10.6% | N/A | Property - UK Commercial |
F&C Investment Trust | 63.2% | 72.8% | 0.45% | Global |
Renewables Infrastructure Grp | -2.0% | -5.8% | 1.04% | Renewable Energy Infrastructure |
| 49.2% | 68.1% | 0.44% | Global Equity Income |
Tritax Big Box Ord | 19.1% | -16.2% | 0.86% | Property - UK Logistics |
Performance figures are retrieved from FE FundInfo on a Total Return is a comprehensive way of measuring investment performance that includes two components: capital appreciation/depreciation (changes in the actual price or value of the investment) and income distributions (any dividends, interest payments, or other distributions paid out during the measurement period)..
Data provided by FE FundInfo, correct as of 30 September 2026.
Best-selling ETFs | September 2026
The most popular ETFs across AJ Bell, Fidelity, Hargreaves Lansdown, and interactive investor were Vanguard FTSE All-World UCITS ETF Acc (VWRP), Vanguard S&P 500 UCITS ETF Acc (VUAG), Vanguard FTSE Global All-Cap ETF USD Acc GBP (VALL), iShares Physical Gold ETC (SGLN) and VanEck Semiconductor UCITS ETF (SMGB).

ETF investors kept it simple this month, gravitating to mainstream global indices. The Vanguard FTSE All World UCITS ETF and the Vanguard FTSE Global All-Cap ETF appeared on all four platforms. The Invesco FTSE All-World UCITS ETF appeared on the AJ Bell and Hargreaves Lansdown platforms, while the iShares Core MSCI World UCITS ETF was also a popular choice. The Vanguard S&P 500 UCITS ETF was a best seller on all four platforms.
As with previous months, semiconductors and gold proved popular. The VanEck Semiconductor ETF appeared on all four platforms, alongside the iShares Physical Gold ETF. The VanEck Junior Gold Miners ETF, which invests in gold mining equities rather than spot gold, appeared on the Fidelity platform’s top-selling list. The gold price has continued to weaken since mid-August as bond yields have risen and the opportunity cost of holding non-yielding gold has grown.
There were tentative signs of a revival in UK equity markets. The iShares Core FTSE 100 UCITS ETF was a best seller on the AJ Bell and Hargreaves Lansdown platforms. The UK market has been out of favour for much of the past decade, but some political stability and surprisingly positive economic data may be improving its popularity. It has also been a useful source of diversification for the AI trade. It is early days, but investors may be returning to the UK market once again.
Best-selling ETFs from AJ Bell
ETF | 3 year performance | 5 year performance | OCF | Sector |
Vanguard FTSE All-World ETF USD Acc GBP (VWRP) | 65.4% | 75.4% | 0.14% | Equity - International |
Vanguard FTSE Global All-Cap ETF USD Acc GBP (VALL) | N/A | N/A | 0.07% | Equity - International |
Vanguard S&P 500 ETF USD Acc GBP (VUAG) | 69.2% | 91.0% | 0.07% | Equity - USA |
iShares Physical Gold ETC GBP (SGLN) | 104.4% | 141.8% | 0.12% | Commodity & Energy |
Vanguard S&P 500 UCITS ETF GBP (VUSA) | 69.4% | 91.3% | 0.07% | Equity - USA |
Vanguard FTSE All-World UCITS ETF GBP (VWRL) | 65.8% | 75.9% | 0.14% | Equity - International |
Invesco FTSE All-World ETF Acc GBP (FWRG) | 65.8% | N/A | 0.15% | Equity - International |
Ishares PLC ISHARES CORE FTSE100 UCITS ETF GBP(DIST) (ISF) | 54.0% | 77.9% | 0.07% | Equity - UK |
VanEck Ucits Etfs PLC VANECK SEMICONDUCTOR UCITS ETF (SMGB) | 289.8% | 372.1% | 0.35% | Equity - Tech Media & Telec |
iShares Physical Silver ETC (SSLN) | 140.4% | 183.5% | 0.21% | Commodity & Energy |
Performance figures are retrieved from FE FundInfo on a Total Return is a comprehensive way of measuring investment performance that includes two components: capital appreciation/depreciation (changes in the actual price or value of the investment) and income distributions (any dividends, interest payments, or other distributions paid out during the measurement period)..
Best-selling ETFs from Fidelity
ETF | 3 year performance | 5 year performance | OCF | Sector |
Vanguard FTSE All-World UCITS ETF USD Accumulation (VWRP) | 65.4% | 75.4% | 0.14% | Equity - International |
Vanguard FTSE Global All-Cap ETF USD Acc GBP (VALL) | N/A | N/A | 0.07% | Equity - International |
Amundi Smart Overnight Return GBP Hedged UCITS ETF Acc (CSH2) | N/A | N/A | 0.55% | Equity - Other Specialist |
iShares Physical Gold ETC (SGLN) | 104.4% | 141.8% | 0.12% | Commodity & Energy |
Vanguard S&P 500 UCITS ETF GBP (VUAG) | 69.2% | 91.0% | 0.07% | Equity - USA |
iShares Core FTSE 100 UCITS ETF GBP TR in GB (ISF) | 54.0% | 77.9% | 0.07% | Equity - UK |
iShares £ Ultrashort Bond UCITS ETF GBP TR in GB (ERNS) | 15.5% | 20.8% | 0.09% | Fixed Int - GBP Short/ Medium |
VanEck Semiconductor UCITS ETF (SMGB) | 289.8% | 372.1% | 0.35% | Equity - Tech Media & Telec |
VanEck Junior Gold Miners UCITS ETF (GJGB) | 243.5% | 227.3% | 0.55% | Commodity & Energy |
iShares S&P 500 Information Technology Sector UCITS ETF GBP (IITU) | 133.6% | 189.6% | 0.15% | Equity - Tech Media & Telec |
Performance figures are retrieved from FE FundInfo on a Total Return is a comprehensive way of measuring investment performance that includes two components: capital appreciation/depreciation (changes in the actual price or value of the investment) and income distributions (any dividends, interest payments, or other distributions paid out during the measurement period)..
Best-selling ETFs from Hargreaves Lansdown
ETF | 3 year performance | 5 year performance | OCF | Sector |
Vanguard FTSE All-World UCITS ETF USD (VWRP) | 65.4% | 75.4% | 0.14% | Equity - International |
Vanguard FTSE Global All-Cap ETF USD Acc GBP (VALL) | N/A | N/A | 0.07% | Equity - International |
Vanguard S&P 500 UCITS ETF USD Acc (VUAG) | 69.2% | 91.0% | 0.07% | Equity - USA |
iShares Physical Metals plc Physical Gold ETC (SGLN) | 104.4% | 141.8% | 0.12% | Commodity & Energy |
Invesco Markets II Plc FTSE All-World UCITS ETF USD Accumulation (FWRG) | 65.8% | N/A | 0.15% | Equity - International |
Vanguard S&P 500 UCITS ETF USD(GBP) (VUSA) | 69.4% | 91.3% | 0.07% | Equity - USA |
Vanguard FTSE All World High Dividend Yield UCITS ETF GBP TR (VHYL) in GB | 57.2% | 77.5% | 0.29% | Equity - International |
VanEck Semiconductor UCITS ETF (SMGB) | 289.8% | 372.1% | 0.35% | Equity - Tech Media & Telec |
Vanguard FTSE All-World UCITS ETF GBP (VWRL) | 65.8% | 75.9% | 0.14% | Equity - International |
iShares Core MSCI World UCITS ETF Acc USD in GB (SWDA) | 64.5% | 78.5% | 0.20% | Equity - International |
Performance figures are retrieved from FE FundInfo on a Total Return is a comprehensive way of measuring investment performance that includes two components: capital appreciation/depreciation (changes in the actual price or value of the investment) and income distributions (any dividends, interest payments, or other distributions paid out during the measurement period)..
Best-selling ETFs from interactive investor
ETF | 3 year performance | 5 year performance | OCF | Sector |
Vanguard FTSE Global All-Cap ETF USD Acc GBP (VALL) | N/A | N/A | 0.07% | Equity - International |
Vanguard FTSE All-World UCITS ETF USD (VWRP) | 65.4% | 75.4% | 0.14% | Equity - International |
iShares Physical Gold ETC (SGLN) | 104.4% | 141.8% | 0.12% | Commodity & Energy |
Vanguard S&P 500 UCITS ETF USD Acc (VUAG) | 69.2% | 91.0% | 0.07% | Equity - USA |
iShares Physical Silver ETC (SSLN) | 140.4% | 183.5% | 0.21% | Commodity & Energy |
Vanguard S&P 500 UCITS ETF USD(GBP) (VUSA) | 69.4% | 91.3% | 0.07% | Equity - USA |
Amundi Smart Overnight Ret GBP H ETF Acc (CSH2) | N/A | N/A | 0.55% | Equity - Other Specialist |
Vanguard FTSE All-World UCITS ETF GBP (VWRL) | 65.8% | 75.9% | 0.14% | Equity - International |
VanEck Semiconductor UCITS ETF (SMGB) | 289.8% | 372.1% | 0.35% | Equity - Tech Media & Telec |
Invesco EQQQ NASDAQ-100 ETF GBP (EQQQ) | 91.7% | 114.1% | 0.30% | Equity - Tech Media & Telec |
Performance figures are retrieved from FE FundInfo on a Total Return is a comprehensive way of measuring investment performance that includes two components: capital appreciation/depreciation (changes in the actual price or value of the investment) and income distributions (any dividends, interest payments, or other distributions paid out during the measurement period)..
Data provided by FE FundInfo, correct as of 30 September 2026.