



Best-selling funds, Investment Trusts and ETFs of April 2025
Discover the most popular investments on the UK's top platforms
By Boring Money
13 May, 2025
Every month, Boring Money conducts rigorous research on what the best-selling investments were across the UK's major investment platforms - including AJ Bell, Fidelity, Hargreaves Lansdown and interactive investor. Scroll down for the full results and expert insights.
Boring Money's expert analysis
After a precarious few weeks following ‘Liberation Day’, global stock markets have bounced back. There is growing expectation that Donald Trump will not follow through on the worst of his tariff threats, and the global economy may yet be spared a recession.
Trump has now negotiated deals with China and the UK, and rolled back the worst of the tariffs for both countries. He has also exempted key industries. Apple, for example, could breathe a sigh of relief as a carve out for small electronics was announced. The company, which has a large manufacturing base in China, had estimated that tariffs could cost it as much as $900m (£677.5m) in the current quarter.[1]
This has, unsurprisingly, changed the mood in markets. After a period when defensive, predictable companies such as utilities, healthcare and consumer staples have done well, the technology sector showed its bouncebackability. The CNBC Magnificent Seven index has risen 12.2% over the past month.[2]
Nevertheless, Europe has continued to outpace the US, with a particularly strong showing from its defence sector. The sector has been buoyed by significant increases in spending from major European powers, particularly Germany, and from the EU itself. Over April, the MSCI Europe rose 4.5% against 0.9% for the MSCI World.
Bond markets have also been more stable after wobbles in March and April. After the US 10-year bond yield spiked in early April, prompting Trump to retreat on his tariffs, it has been relatively stable at between 4.25% and 4.5%.[3] Nevertheless, the Federal Reserve has resisted pressure from the US administration to cut rates, saying that it needs more clarity over the potential impact of tariffs on inflation and jobs.
It remains an uncertain moment for investors. The final shape of the tariff regime is still unclear, even if markets appear to be over the worst. There is also the danger that Donald Trump may have more up his sleeve.
Best-selling funds | April 2025
The most popular A collection of assets wrapped up in a single product, managed for you by an expert. A fund will hold anywhere from a few dozen to several thousand investments. The specific number depends on the fund’s strategy and objectives. across multiple platforms including AJ Bell, Fidelity, Hargreaves Lansdown and interactive investor was Fidelity Index World.
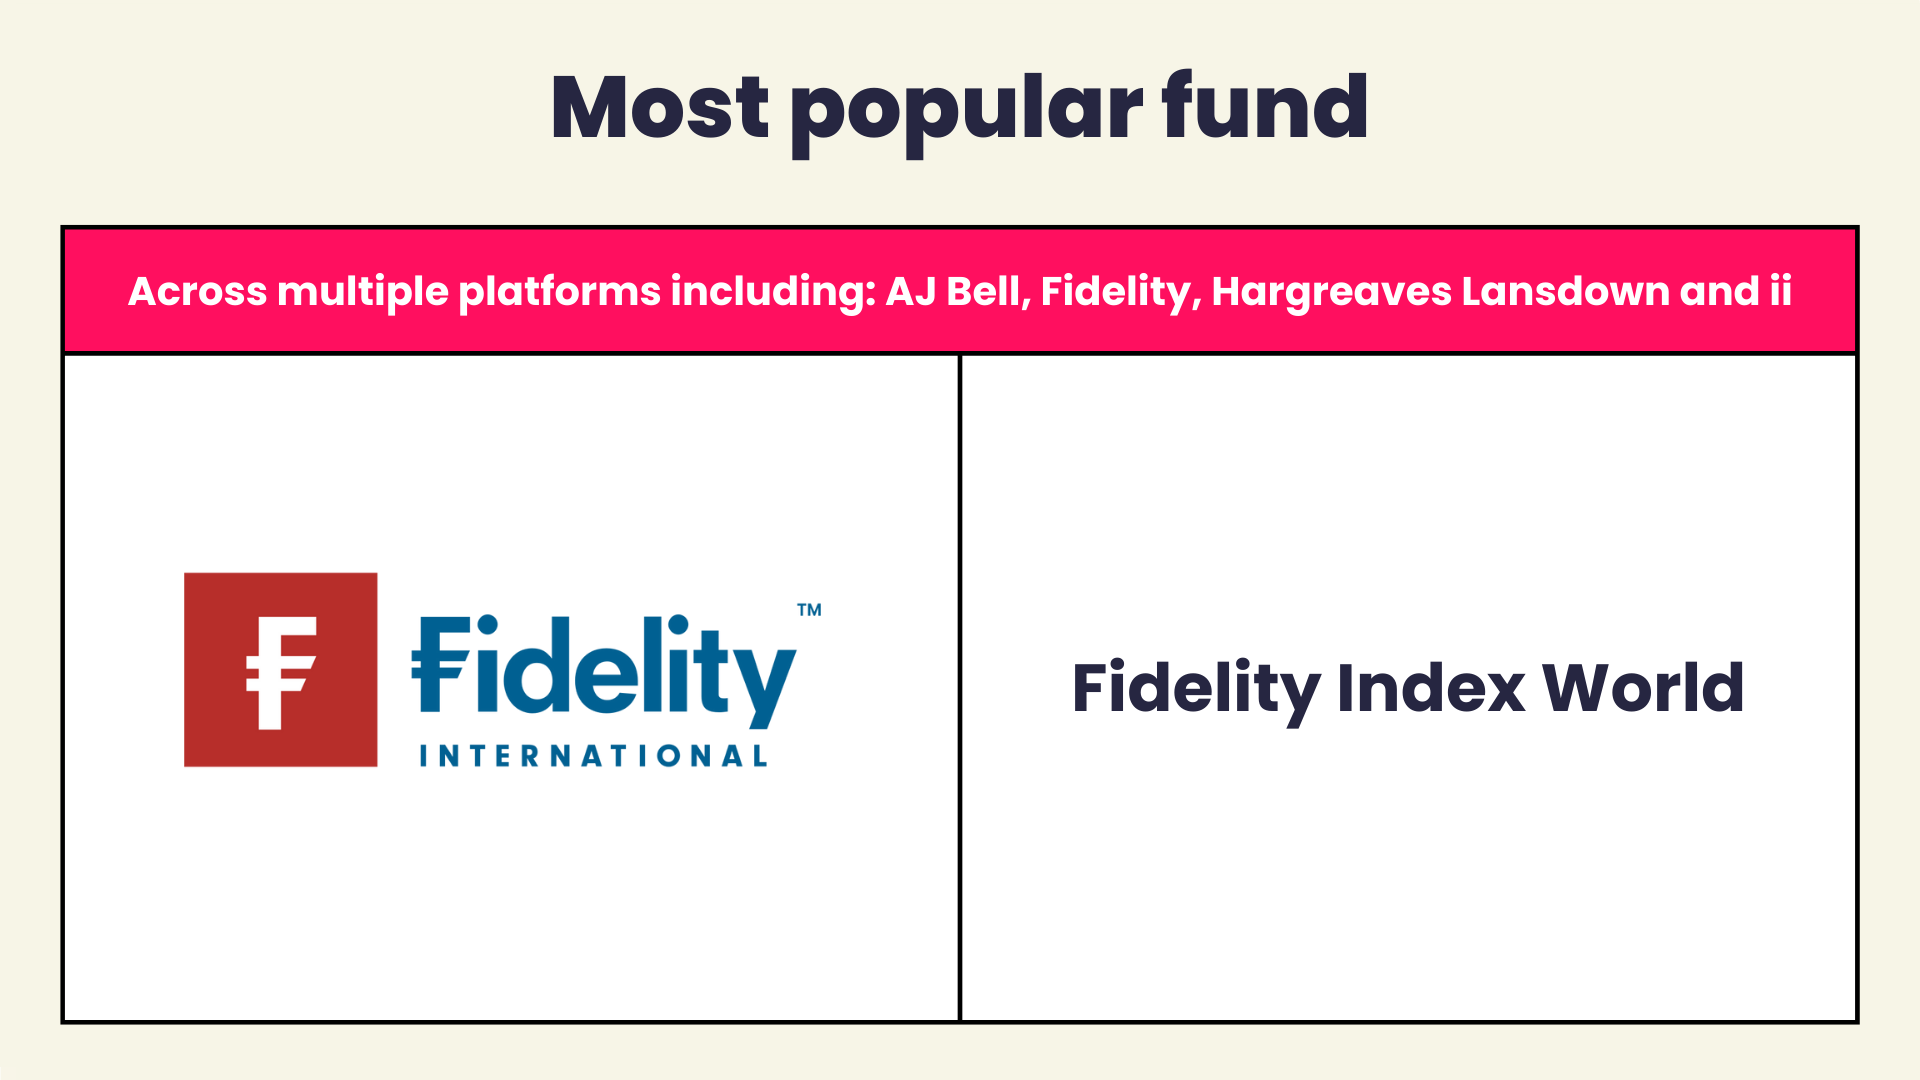
Investors were feeling more adventurous as markets recovered over the month. Across all four platforms, the Fidelity Index World fund was, once again, the top-selling individual fund. The fund tracks the MSCI World index, which currently has over 70% invested in the US, and over 20% invested in the ‘Magnificent Seven’ mega-cap technology companies.[4] This may help explain the resilience of the US market.
The Legal & General Global Technology Index fund continued to be popular across three out of the four platforms. On Hargreaves Lansdown, the UBS S&P 500 index was the top-seller, showing investors haven’t lost their appetite for the US stock market.
Elsewhere, there were other signs of investor optimism. On the AJ Bell platform, its home-grown Adventurous and Moderately Adventurous funds were popular. That said, this also suggested investors were more inclined to hand fund selection to an expert than pick individual funds themselves. The popularity of the Vanguard LifeStrategy 80% Equity fund across all four platforms also suggested investors were looking for a balanced approach.
Some investor nervousness remained. On the ii platform, the Royal London Short Term Money Market fund was the top-seller, and the Fidelity Cash and Legal & General Cash Trust funds were top sellers on the Fidelity platform.
Best-selling funds from AJ Bell
Funds | 3 year performance | 5 year performance | Ongoing Charges Figure |
AJ Bell Adventurous | 18.47% | 58.81% | 0.31% |
Fidelity Index World | 26.41% | 78.71% | 0.12% |
AJ Bell Moderately Adventurous | 13.89% | 44.12% | 0.31% |
AJ Bell Balanced | 11.18% | 33.58% | 0.31% |
AJ Bell Global Growth | 14.52% | 59.04% | 0.31% |
Vanguard LifeStrategy 100% Equity | 24.83% | 72.05% | 0.22% |
HSBC FTSE All-World Index | 23.61% | 72.51% | 0.13% |
Vanguard FTSE Global All Cap Index | 23.91% | 72.09% | 0.23% |
AJ Bell Responsible | 11.95% | N/A | 0.45% |
Vanguard LifeStrategy 80% Equity | 18.82% | 51.02% | 0.22% |
Best-selling funds from Fidelity
Funds | 3 year performance | 5 year performance | Ongoing Charges Figure |
Fidelity Cash Fund | 13.06% | 13.08% | 0.15% |
Fidelity Index World | 26.41% | 78.71% | 0.12% |
Royal London Short Term Money Market | 13.47% | 13.62% | 0.10% |
Fidelity Global Dividend | 32.23% | 64.08% | 0.92% |
Legal & General Cash Trust | 13.12% | 13.14% | 0.15% |
Legal & General Global Technology Index | 45.16% | 123.38% | 0.32% |
Rathbone Global Opportunities | 28.20% | 67.78% | 0.51% |
Fidelity Index US Fund | 27.78% | 88.55% | 0.06% |
Fidelity Special Situations | 32.01% | 93.32% | 0.92% |
Fidelity Funds - Global Technology | 39.93% | 121.31% | 1.04% |
Best-selling funds from Hargreaves Lansdown
Funds | 3 year performance | 5 year performance | Ongoing Charges Figure |
UBS S&P 500 Index | 31.50% | 92.07% | 0.09% |
Fidelity Index World | 26.41% | 78.71% | 0.12% |
Legal & General US Index | 24.96% | 85.50% | 0.05% |
Legal & General International Index Trust | 23.18% | 76.67% | 0.08% |
Legal & General Global Technology Index | 45.64% | 124.73% | 0.20% |
Artemis Global Income | 48.60% | 127.26% | 0.87% |
HL Adventurous Managed | N/A | N/A | 0.90% |
Vanguard FTSE Global All Cap Index | 23.91% | 72.09% | 0.23% |
HL Moderately Adventurous Managed | N/A | N/A | 0.88% |
Legal & General European Index | 31.85% | 72.17% | 0.06% |
Best-selling funds from interactive investor
Funds | 3 year performance | 5 year performance | Ongoing Charges Figure |
Royal London Short Term Money Market | 13.47% | 13.62% | 0.10% |
Vanguard LifeStrategy 80% Equity | 18.82% | 51.02% | 0.22% |
HSBC FTSE All-World Index | 23.61% | 72.51% | 0.13% |
Vanguard LifeStrategy 100% Equity | 24.83% | 72.05% | 0.22% |
Legal & General Global Technology Index | 45.16% | 123.38% | 0.32% |
Vanguard FTSE Global All Cap Index | 23.91% | 72.09% | 0.23% |
Fidelity Index World | 26.41% | 78.71% | 0.12% |
Vanguard LifeStrategy 60% Equity | 12.95% | 32.14% | 0.22% |
Vanguard US Equity Index | 28.51% | 87.31% | 0.10% |
Fundsmith Equity | 10.15% | 41.76% | 0.94% |
Data provided by FE Fundinfo, correct as at 30 April 2025.
Best-selling Investment Trusts | April 2025
The most popularFunctions like a typical fund, but is structured as a public limited company (PLC) which can be traded on the stock market. Has certain exclusive capabilities, such as being able to store income during lucrative periods to maintain generous dividend payments when performance dips. across AJ Bell, Fidelity, Hargreaves Lansdown and interactive investor were Scottish Mortgage, JPMorgan Global Growth & Income, City of London, and F&C.
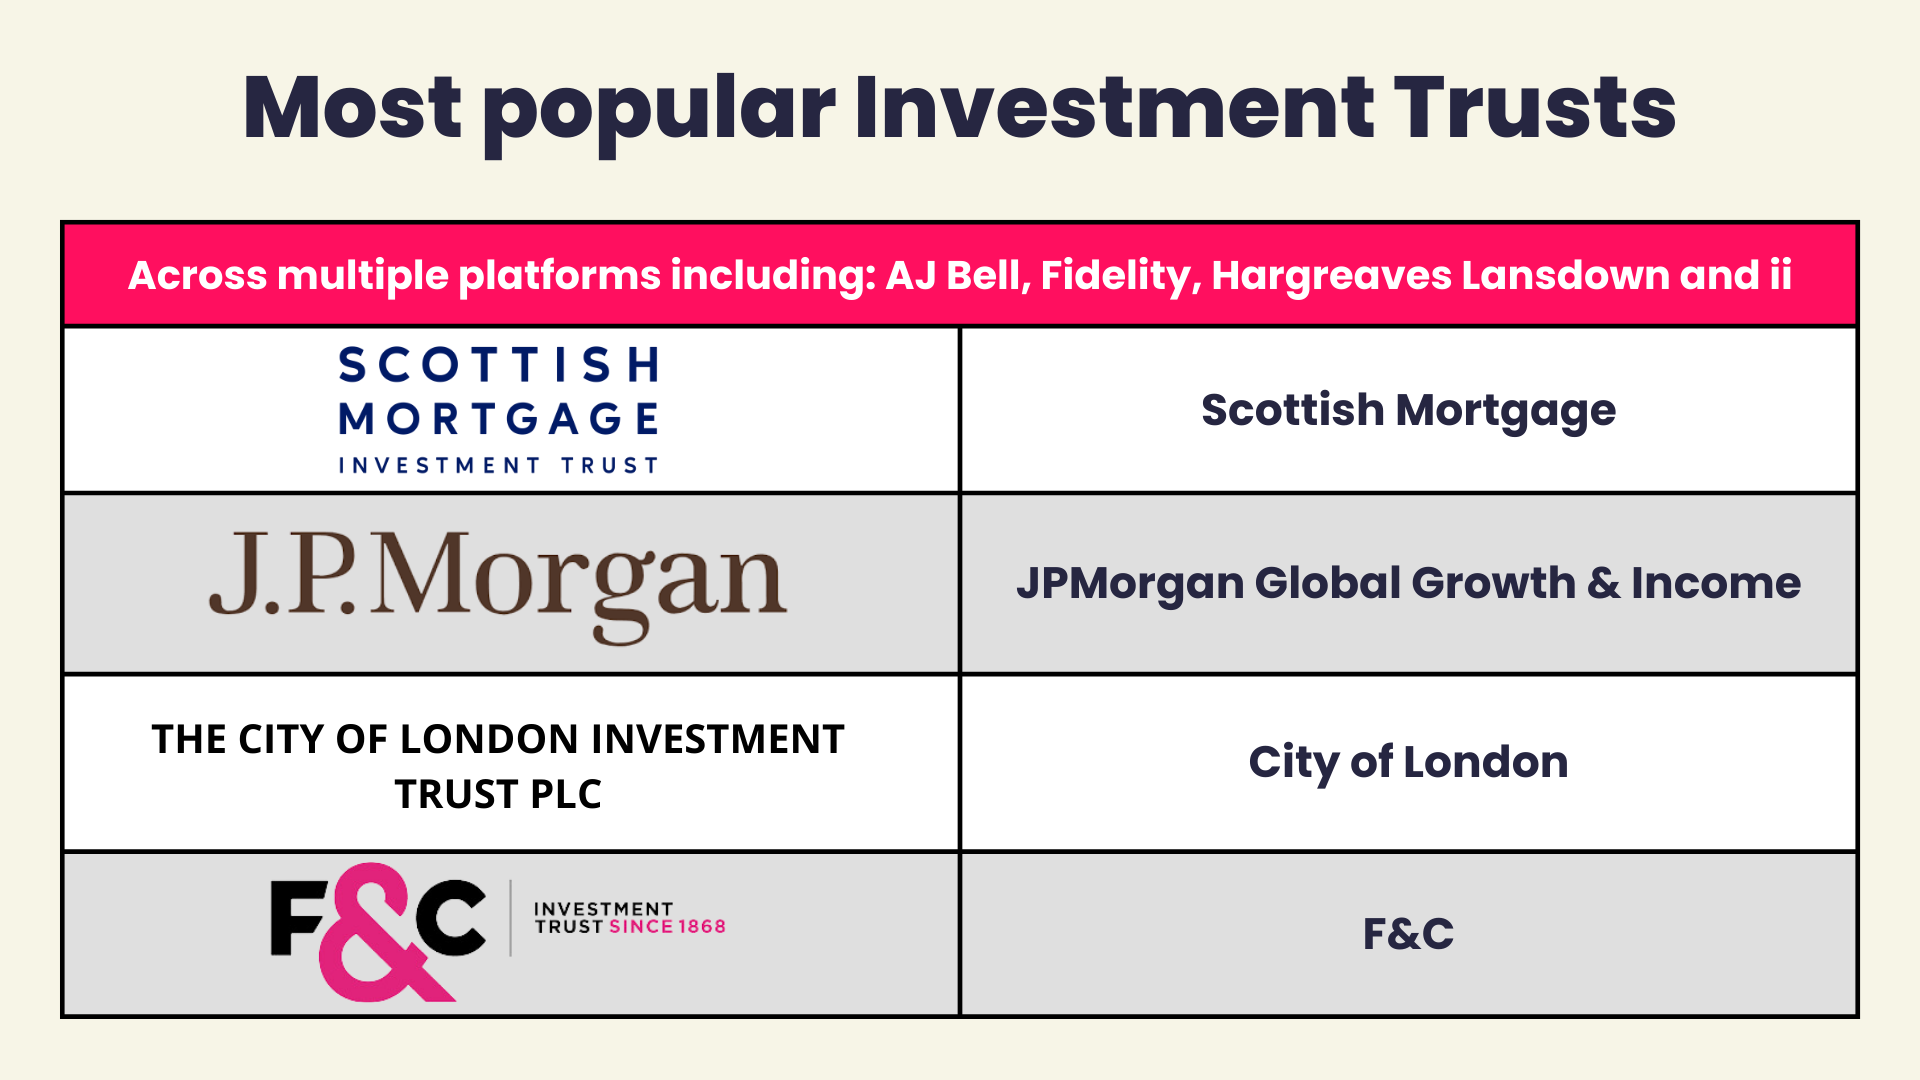
Investment Trust investors remained largely immune to the volatility in global stock markets over the month. Higher growth, technology-focused Scottish Mortgage was a top seller across all four platforms. However, more conservative trusts also proved popular with advisers - with JP Morgan Global Growth & Income, City of London, and F&C also appearing across all four best buy lists.
Investors also showed some appetite for Asia-focused funds. These have been out of favour, but China has started to show signs of economic recovery and a turnaround in its under-pressure property sector. The China Special Situations fund was a popular choice on the Fidelity platform, while Henderson Far East Income featured on the Interactive Investor platform. The JP Morgan Emerging Markets fund featured on the AJ Bell platform.
The technology funds – from Polar and Allianz Global Investors - were also popular, in spite of the volatility in the sector. Investors may have used lower valuations as a chance to buy in at lower cost (also known as "buying the dip").
As with last month, there were also signs that investors were leaning into alternatives, possibly in a drive for greater portfolio diversification at a time of unsettled markets. Greencoat UK Wind and RIT Capital Partners featured on the AJ Bell platform, while International Public Partnerships and GCP Infrastructure investments were popular among Fidelity’s investors. Greencoat UK Wind also appeared on the Hargreaves platform, alongside Renewables Infrastructure and 3i. 3i and Greencoat UK Wind were also on the best-seller list from ii.
Best-selling Investment Trusts from AJ Bell
Investment Trusts | 3 year performance | 5 year performance | Ongoing Charges Figure |
JPMorgan Global Growth & Income | 24.59% | 103.02% | 0.53% |
Scottish Mortgage | -0.04% | 38.50% | 0.35% |
City of London | 27.85% | 72.98% | 0.37% |
Law Debenture | 26.21% | 119.92% | 0.49% |
F&C | 28.97% | 72.95% | 0.45% |
RIT Capital Partners | -21.65% | 10.99% | 2.08% |
Personal Assets | 5.42% | 25.42% | 0.65% |
Polar Capital Technology | 41.42% | 62.63% | 0.80% |
Greencoat UK Wind | -12.32% | 15.24% | 0.95% |
JPMorgan Emerging Markets | 0.12% | 25.63% | 0.90% |
Best-selling Investment Trusts from Fidelity
Investment Trusts | 3 year performance | 5 year performance | Ongoing Charges Figure |
Scottish Mortgage | -0.04% | 38.50% | 0.35% |
Fidelity China Special Situations | 1.58% | 14.76% | 0.88% |
Allianz Technology | 40.04% | 89.84% | 0.80% |
JPMorgan Global Growth & Income | 24.59% | 103.02% | 0.53% |
F&C | 28.97% | 72.95% | 0.45% |
City of London | 27.85% | 72.98% | 0.37% |
Fidelity European | 40.01% | 87.12% | 0.77% |
International Public Partnerships | -20.01% | -6.10% | 1.14% |
Fidelity Special Values | 28.12% | 112.84% | 0.70% |
GCP Infrastructure Investments | -25.64% | -12.61% | 1.13% |
Best-selling Investment Trusts from Hargreaves Lansdown
Investment Trusts | 3 year performance | 5 year performance | Ongoing Charges Figure |
Scottish Mortgage | -0.04% | 38.50% | 0.35% |
City of London | 27.85% | 72.98% | 0.37% |
Greencoat UK Wind | -12.32% | 15.24% | 0.95% |
JPMorgan Global Growth & Income | 24.59% | 103.02% | 0.53% |
F&C | 28.97% | 72.95% | 0.45% |
Polar Capital Technology | 41.42% | 62.63% | 0.80% |
International Public Partnerships | -20.01% | -6.10% | 1.14% |
Henderson Far East Income | -7.48% | 3.38% | 1.08% |
Renewables Infrastructure | -27.89% | -11.94% | 0.88% |
3i Group | 249.40% | 531.57% | 0.80% |
Best-selling Investment Trusts from interactive investor
Investment Trusts | 3 year performance | 5 year performance | Ongoing Charges Figure |
Scottish Mortgage | -0.04% | 38.50% | 0.35% |
City of London | 27.85% | 72.98% | 0.37% |
JPMorgan Global Growth & Income | 24.59% | 103.02% | 0.53% |
Greencoat UK Wind | -12.32% | 15.24% | 0.95% |
Alliance Witan | 25.41% | 73.36% | 0.56% |
F&C | 28.97% | 72.95% | 0.45% |
Polar Capital Technology | 41.42% | 62.63% | 0.80% |
Allianz Technology | 40.04% | 89.84% | 0.80% |
3i Group | 249.40% | 531.57% | 0.80% |
Henderson Far East Income | -7.48% | 3.38% | 1.08% |
Data provided by FE Fundinfo, correct as at 30 April 2025.


The unswerving search for quality
“It’s a rare business that doesn’t have a way worse future than it has a past.” – Charlie Munger
On Murray Income Trust, quality is our lodestar. It is the guiding philosophy that drives our investment decision-making, helping us uncover those companies that can deliver strong, repeatable returns year after year - or in other words - companies that have at least as good a future as their past. Quality companies are rare, and hard to find. We have made it our business to discover them.
There are clear reasons to search for quality companies. They tend to have two key performance characteristics: their cash flows, revenues and dividends tend to be consistent and predictable in the short-term, but more importantly, their advantages build over time because of careful capital allocation, strong management teams and competitive positioning.
The worry for investors is that these companies are too expensive. Yet we believe that the market consistently underestimates the sustainability of returns from these high-quality companies. While they may not look cheap, they will often be undervalued versus their long-term prospects.
Capital at risk. Read more.
DISCOVER MORE
Best-selling ETFs | April 2025
The most popular A type of fund made up of a number of assets which can be bought and sold on the stock market, in the same way as you would with individual shares. across AJ Bell, Fidelity, Hargreaves Lansdown and interactive investor were Vanguard S&P 500 Dist (VUSA), Vanguard S&P 500 Acc (VUAG), iShares Physical Gold (SGLN), Invesco NASDAQ 100 (EQQQ), Vanguard FTSE All-World Acc (VWRP), and iShares Core FTSE 100 (ISF).
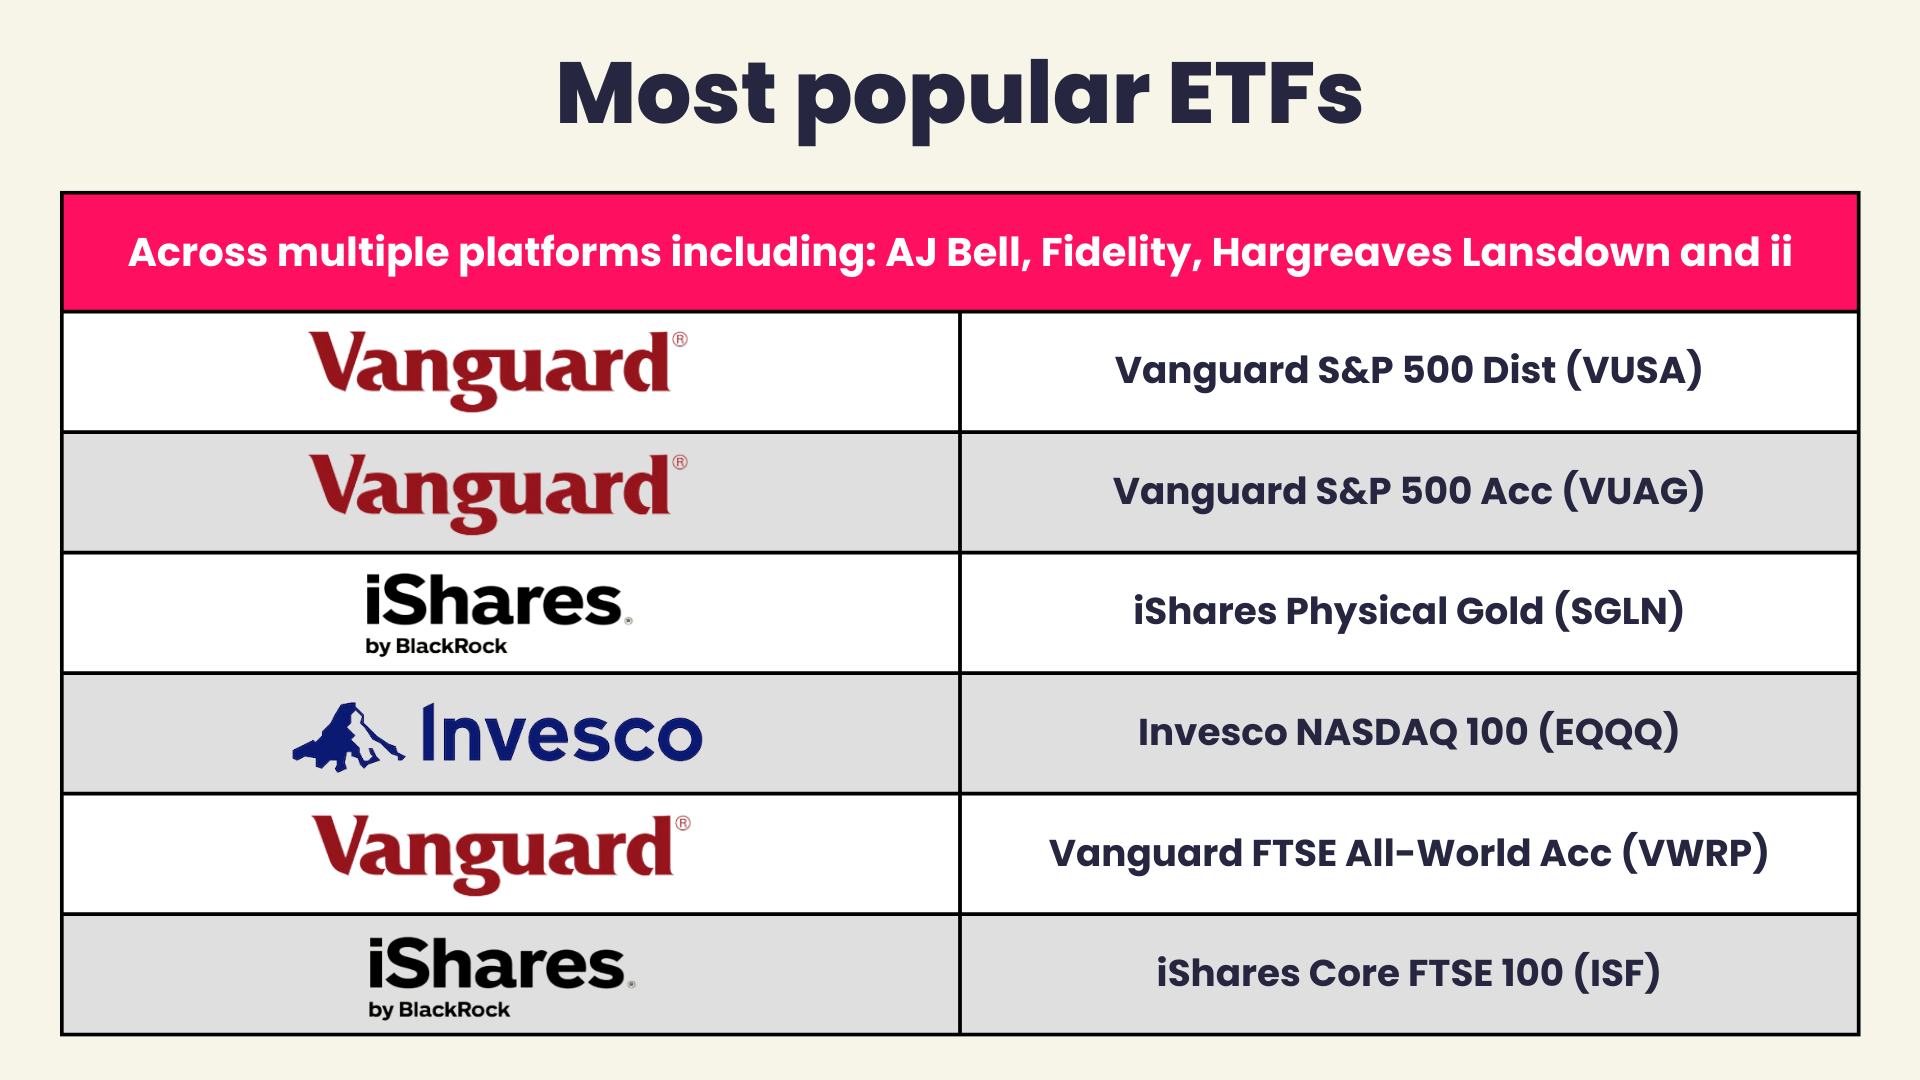
ETFs offer flexible, theme-focused investment opportunities that can be tailored to specific sectors or strategies. As a result, investors will often use them to take advantage of shorter-term trends in markets. They can therefore be a good indicator of what markets are thinking.
This month, the ETF data showed real polarisation. On the one hand, S&P 500-focused ETFs were popular as investors looked to buy the dip. Investors were buying into both Dollar-denominated and sterling-based S&P 500 ETFs, but Dollar ETFs had the edge as investors sought to take advantage of the weakened US currency.
At the opposite end of the scale was the popularity of physical gold ETFs, which were a feature on all four platforms. Gold has been a significant beneficiary of the volatility in stock markets since the start of the year, but its strength has started to ebb as some stability has returned to financial markets. The iShares Physical Gold proved most popular.
The UK proved a surprisingly popular choice, with the iShares Core FTSE 100 ETF featuring on all four platforms. There have been better signs coming out of the UK economy and the market is cheap, which may have drawn in investors disaffected with the US. A UK/US trade deal may see this popularity continue.
Last month’s enthusiasm for defence funds was not in evidence this month, with investors returning to the mainstay technology-focused ETFs.
Best-selling ETFs from AJ Bell
ETFs | 3 year performance | 5 year performance | Ongoing Charges Figure |
Vanguard S&P 500 UCITS ETF GBP (VUSA) | 31.54% | 92.27% | 0.07% |
Vanguard S&P 500 UCITS ETF USD Acc (VUAG) | 31.54% | 92.27% | 0.07% |
iShares Physical Gold ETC (SGLN) | 61.81% | 81.93% | 0.12% |
iShares Core S&P 500 UCITS ETF USD (CSP1) | 31.56% | 92.27% | 0.07% |
iShares Core FTSE 100 (ISF) | 25.54% | 71.95% | 0.07% |
Vanguard FTSE All-World UCITS ETF (VWRL) | 26.03% | 74.46% | 0.22% |
Vanguard FTSE All-World UCITS ETF USD (VWRP) | 26.03% | 74.46% | 0.22% |
Invesco NASDAQ 100 UCITS (EQQQ) | 44.99% | 109.45% | 0.30% |
iShares Core MSCI World (SWDA) | 28.96% | 82.04% | 0.20% |
Vanguard FTSE Dev Europe ex-UK (VERX) | 30.80% | 75.09% | 0.10% |
Best-selling ETFs from Fidelity
ETFs | 3 year performance | 5 year performance | Ongoing Charges Figure |
iShares Physical Gold ETC (SGLN) | 61.81% | 81.93% | 0.12% |
Vanguard S&P 500 UCITS ETF USD Acc (VUAG) | 31.54% | 92.27% | 0.07% |
Vanguard S&P 500 UCITS ETF GBP (VUSA) | 31.54% | 92.27% | 0.07% |
Invesco NASDAQ 100 UCITS (EQQQ) | 44.99% | 109.45% | 0.30% |
Vanguard FTSE All-World UCITS ETF USD (VWRP) | 26.03% | 74.46% | 0.22% |
iShares Core S&P 500 UCITS ETF USD (CSP1) | 31.56% | 92.27% | 0.07% |
Vanguard FTSE 100 (VUKE) | 25.48% | 71.92% | 0.09% |
iShares Core FTSE 100 (ISF) | 25.54% | 71.95% | 0.07% |
iShares NASDAQ 100 UCITS ETF USD (CNX1) | 44.87% | 109.11% | 0.30% |
iShares S&P 500 Information Technology (IITU) | 59.45% | 147.23% | 0.15% |
Best-selling ETFs from Hargreaves Lansdown
ETFs | 3 year performance | 5 year performance | Ongoing Charges Figure |
Vanguard S&P 500 UCITS ETF USD Acc (VUAG) | 31.54% | 92.27% | 0.07% |
Vanguard S&P 500 UCITS ETF GBP (VUSA) | 31.54% | 92.27% | 0.07% |
Vanguard FTSE All-World UCITS ETF USD (VWRP) | 26.03% | 74.46% | 0.22% |
iShares Physical Gold ETC (SGLN) | 61.81% | 81.93% | 0.12% |
Invesco NASDAQ 100 UCITS (EQQQ) | 44.99% | 109.45% | 0.30% |
iShares Core FTSE 100 (ISF) | 25.54% | 71.95% | 0.07% |
Vanguard FTSE All-World UCITS ETF (VWRL) | 26.03% | 74.46% | 0.22% |
Invesco FTSE All-World UCITS ETF (FWRG) | N/A | N/A | 0.15% |
iShares Core MSCI World (SWDA) | 28.96% | 82.04% | 0.20% |
Vanguard FTSE Developed World (VHVG) | 28.66% | 80.87% | 0.12% |
Best-selling ETFs from interactive investor
ETFs | 3 year performance | 5 year performance | Ongoing Charges Figure |
Vanguard S&P 500 UCITS ETF GBP (VUSA) | 31.54% | 92.27% | 0.07% |
Vanguard S&P 500 UCITS ETF USD Acc (VUAG) | 31.54% | 92.27% | 0.07% |
iShares Physical Gold ETC (SGLN) | 61.81% | 81.93% | 0.12% |
Invesco NASDAQ 100 UCITS (EQQQ) | 44.99% | 109.45% | 0.30% |
Vanguard FTSE All-World UCITS ETF (VWRL) | 26.03% | 74.46% | 0.22% |
iShares Core FTSE 100 (ISF) | 25.54% | 71.95% | 0.07% |
iShares Core MSCI World (SWDA) | 28.96% | 82.04% | 0.20% |
Vanguard FTSE All-World UCITS ETF USD (VWRP) | 26.03% | 74.46% | 0.22% |
iShares Core S&P 500 UCITS ETF USD (CSP1) | 31.56% | 92.27% | 0.07% |
Vanguard FTSE Developed World (VHVG) | 28.66% | 80.87% | 0.12% |
Data provided by FE Fundinfo, correct as at 30 April 2025.
---